October 2022
On 25/10/22 the Financial Conduct Authority (FCA) published an exciting consultation paper, CP22/20: Sustainability Disclosure Requirements (SDR) and investment labels, which includes a package of measures designed to reduce greenwashing amongst companies that sell investment products.
In this context, greenwashing happens when a company claims that certain sustainability considerations have been integrated into the construction and management of an investment product, and the company subsequently either doesn’t integrate these sustainability considerations or integrates a slightly different set of considerations. The most important bit of the paper is the introduction of the following sustainable investment product labels: Sustainable Focus, Sustainable Improvers, Sustainable Impact.
Unlike the Sustainable Finance Disclosure Regulation (SFDR), a similar set of rules in Europe, these labels are not mandatory for all investment products. Instead, products without one of these labels will simply be unable to use most sustainability-flavoured terms like Sustainable Development Goal (SDG) or Net Zero. The FCA has also emphasised that no label is ‘better’ than another.
This caveat further separates the proposed labels from SFDR, which segments all products into a sustainability hierarchy. We believe that this package of measures represents meaningful progress as part of the FCA’s ESG Strategy and Business Plan. We are particularly pleased by the regulator’s focus on the consumer; in addition to the proposed labels, the paper also details how companies should explain key sustainability-related features of relevant investment products, including any sustainability targets, the approach to measuring progress towards these targets, and if products contain any exposure to unexpected investments (for example, if a product with the Sustainable Improvers label is exposed to companies deriving revenue from fossil fuel
November 2022
COP27 (which stands for Conference of the Parties), like COP26 last year, was about as successful as expected. The headline victory was the establishment of a “loss and damage” facility, which was decades in the making and a boon for climate justice advocates. But the announcement rings a little hollow because no cash was forked out and it sounds, at this stage, a little like funding promises made at COP15 in Denmark (although some progress was made on “just” transition plans for Indonesia and Vietnam).
More, The final cover text was injected with a healthy dose of last-minute realpolitik. The reference to “low-emission energy” was a nod to a renewed appreciation for energy security in addition to energy sustainability. It looks a little like a loophole designed to allow things like fossil gas a greater role in the decarbonisation of the global economy and is surely a product of the gaggle of lobbyists present in Egypt representing the fossil fuels industry. Achieving a consensus can be tricky for family members gathered around the dinner table.
It is trickier still for the 198 parties to the United Nations Framework Convention on Climate Change (UNFCC), for which COPs are the essential decision-making body. Nevertheless, it is critical that those with the means [and responsibility] to help do so. Not only because it is the right thing to do, but also to reap the potential benefits of such assistance (the World Bank estimates the benefits to be 4x the costs).
December 2022
December capped a busy year of policy and pledges across the ESG ecosystem. Earlier in 2022, the USA Securities and Exchange Commission (SEC) and the FCA published lengthy proposals designed to improve transparency and comparability of non-financial data. Regulators in the EU completed the trifecta, as investors prepared for the introduction of the second level of SFDR.
Due to the new rules, many funds were forced to reclassify from Article 9 to Article 8, representing a de facto downgrade from a sustainability POV. Critics were quick to suggest foul play on the part of investors for incorrectly classifying funds in the first place, but the story is more complicated than that. Part of the blame for the downgrades must sit with regulators for changing the goal posts regarding the requirements to achieve an Article 9 classification.
Indeed, a good number of the downgrades were for ETFs following EU-blessed Paris-aligned benchmarks. Elsewhere, delegates left the negotiating table of COP15 (the biodiversity conference, rather than the climate change conference of the same name) with a spring in their step; some even likened the significance of the outcomes to that of the Paris Agreement.
The headline victory, an agreement to protect and restore at least 30% of the Earth’s land and water by 2030, is certainly a powerful bit of rhetoric. And it was accompanied by sizeable spending pledges, if not quite as big as hoped for. The risk, as with other loud proclamations made at COPs past, is that the rhetoric races ahead of the reality. It is now the task of both the public and the private sector to ensure that this doesn’t happen.
Q1 2023
ESG ratings, like those built by MSCI, are an excellent tool to help us better understand how well ESG-relevant risks and opportunities are being managed by companies. That is, to gauge how things in the real world are affecting the companies held across our proposition.
However, that is only one side of the coin. It is also possible to measure how our proposition is affecting things in the real world, and indeed this is the purpose of the Impact Statistics section of this report. After a series of trials with a range of data providers, we concluded that Util, a London-based fintech company, was the perfect fit for our needs. Util have designed a robust tool that allows investors like us to see how our investments are affecting the 17 UN SDGs, which can be further broken down into thousands of sustainability concepts.
Util’s tool relies on natural language processing to disaggregate a company into the constituent products that it sells. These products are than mapped to one or more sustainability concepts drawn from more than 120 million peer-reviewed academic journals (a process done by a machine, not human analysts!). Once the products have been linked to these concepts, and then to the SDGs, the data can be re-aggregated to the company, then the fund, and finally to the level of our proposition.
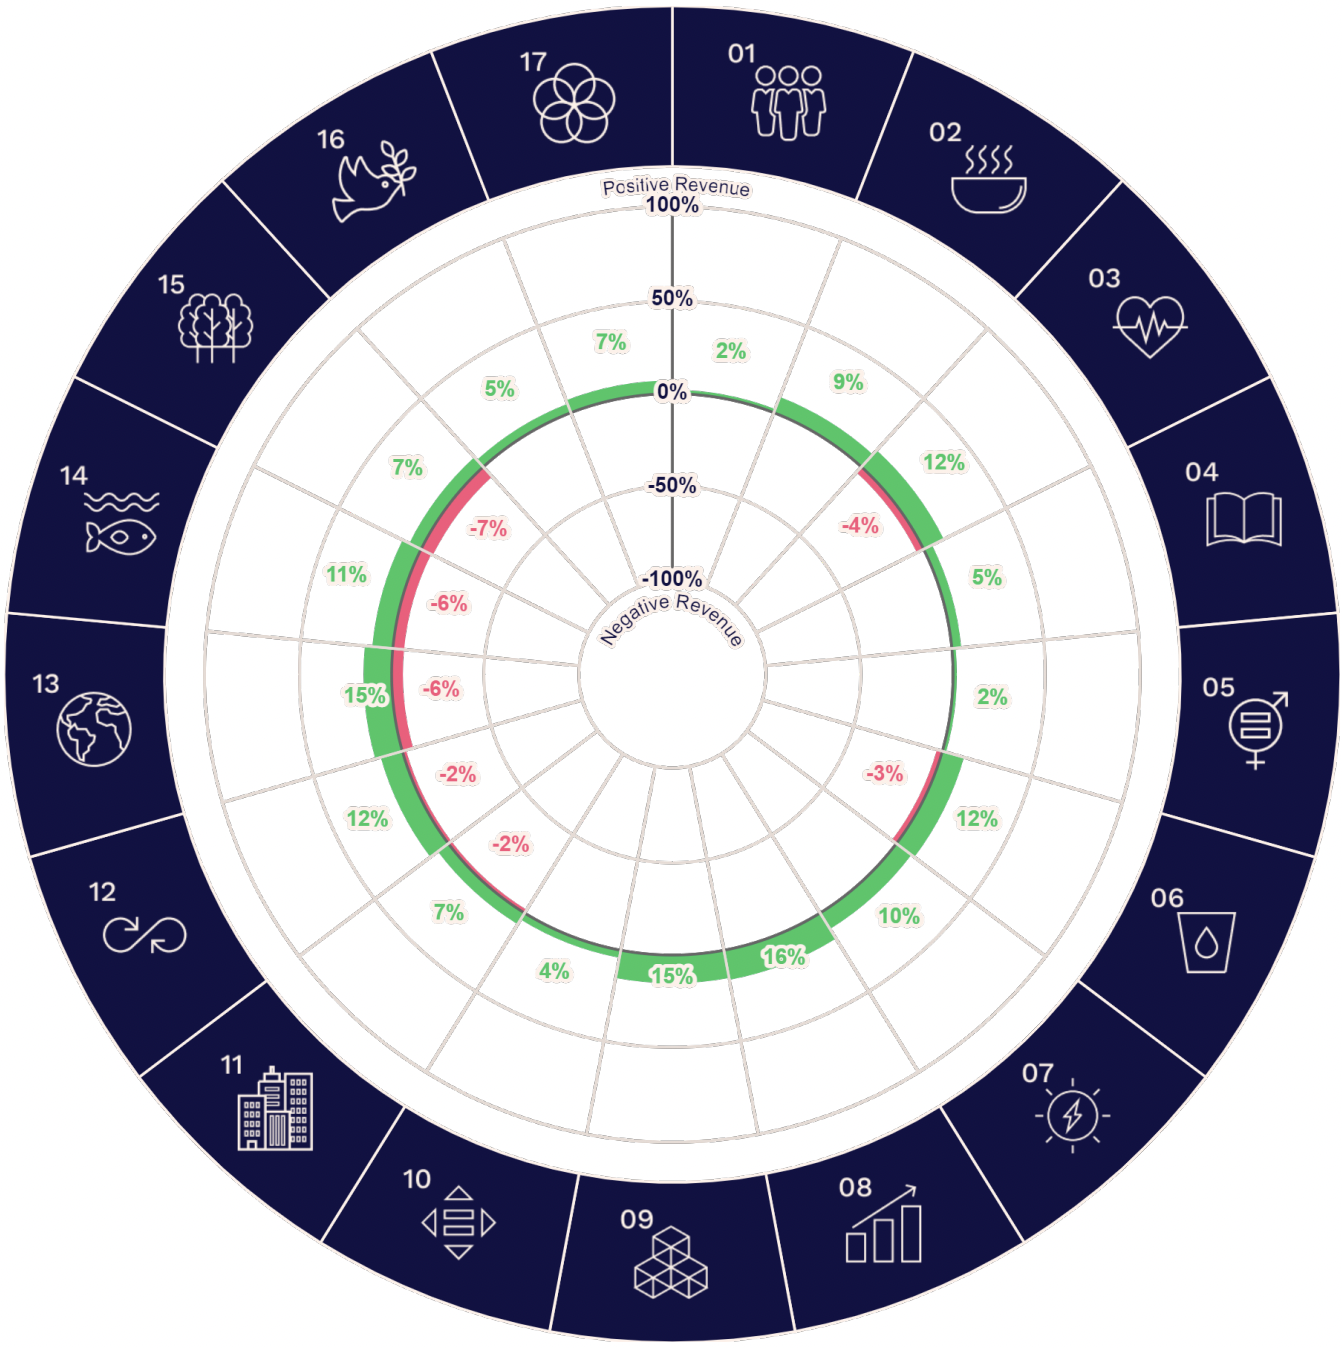
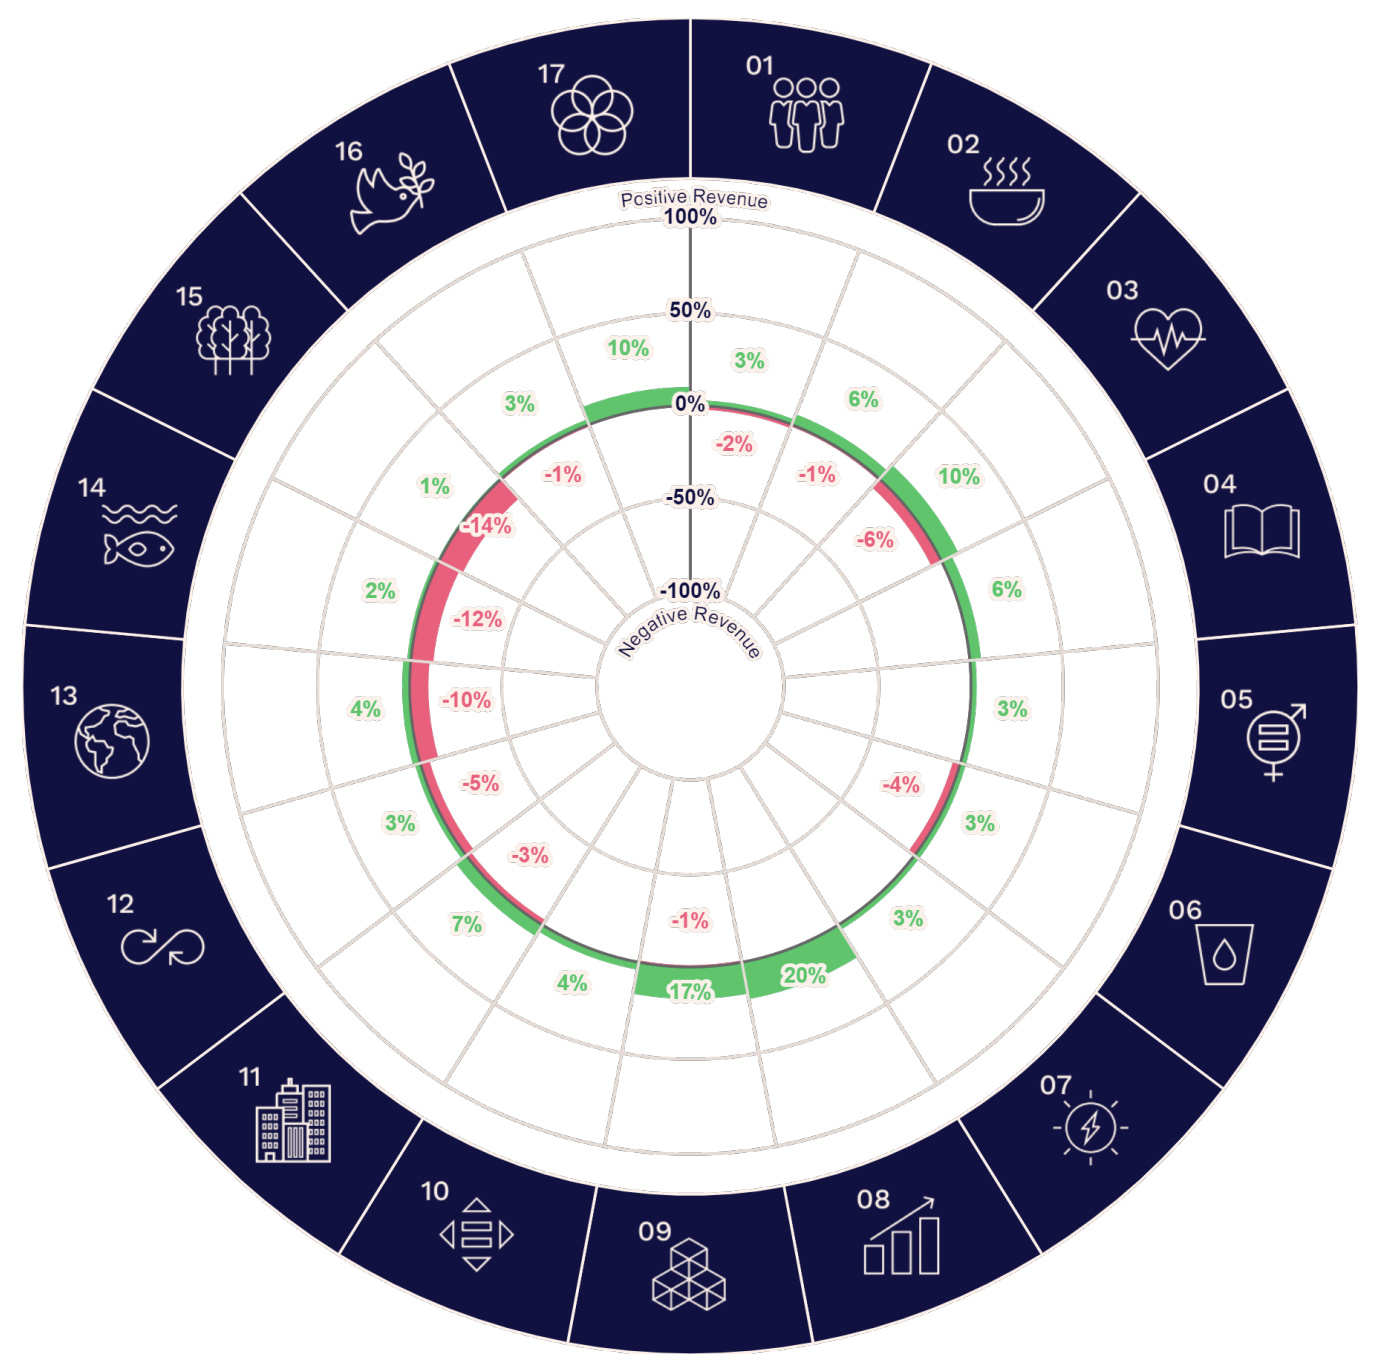
We believe this methodology to be intelligent and, importantly, transparent. With the data crunching complete, we are then able see, using a radial chart like the one below, how a company, fund or model is affecting each of the SDGs. This chart shows the data for the Triodos Pioneer Impact Fund, one of the allocations held across our proposition. We can see that, as expected, the fund is mostly positively aligned with the SDGs, especially those that align nicely with the objectives of the fund.
However, the alignment is imperfect. We can also see that, from a product POV, there are some negative outcomes. Drilling down into the data, it appears that the fund has residual exposure to things like electricity transmission and shipping containers, both of which negatively impact SDG 15 (life on land).
This level of detail is invaluable both for us as portfolio managers, and for financial advisers to be able to build narrative around our sustainable investment proposition with their clients.
Case Studies
Equity: Paris-Aligned Benchmarks (PAB)
A common criticism of sustainability-labelled passive investment products is that the sustainability bit of the methodology is often a little light-touch. Sometimes the index that the product tracks will simply screen out exposure to certain controversial sectors like tobacco or thermal coal. Other times the product will focus on a sustainability-linked theme like clean energy or the circular economy.
In either case it is at least questionable as to whether, in the real world, these products are helping to progress the transition to a more sustainability-minded planet. The EU Paris-Aligned Benchmarks (PAB), first introduced in 2019, are a welcome rebuttal to this criticism.
The purpose of the PAB methodology is primarily to identify companies aligned with the goal of the Paris Agreement, which is to limit global warming to below 2C above pre-industrial levels, and preferably below 1.5C. That doesn’t mean that all of the companies included in a PAB-labelled index are currently aligned to this goal; indeed, according to MSCI about 90% of all public companies are not yet aligned. Instead, the methodology allows for an element of transition. Each PAB-labelled index must, at inception, achieve a 50% reduction in carbon intensity compared to its vanilla parent index. It must then reduce its carbon intensity by a further 7% each year to ensure that, by 2050, the 1.5C goal is met. This forward-looking approach is particularly novel because another common criticism of sustainability-labelled passive investment products is that underlying methodologies are backwards looking.
It is all well and good to ensure that the goal of the Paris Agreement is achieved. But the cost of achieving this goal must not be a case of taking from Peter to give to Paul. Thus, another feature of the PAB methodology is the inclusion of the EU Taxonomy’s ‘Do No Significant Harm’ (DNSH) principle, which requires that business activities helping with any one of the Taxonomy’s environmental objectives must not be causing significant harm to other objectives.
We have exposure to the PAB methodology through the Amundi MSCI World SRI PAB Index Fund and the Amundi MSCI Emerging Markets SRI PAB Index Fund. The first fund achieves an MSCI ESG Quality Score of 8.89 (AAA) and top holdings include ASML, Home Depot and Tesla. The second fund achieves an MSCI ESG Quality Score of 7.52 (AAA) and top holdings include Meituan, TSMC
and Unilever HUL.
High Level Statistics
The purpose of this section is primarily to measure how well we are managing exposure to material ESG risks and opportunities (see Appendix for more details). Looking at the charts in this section, we can see that we are managing exposure to material ESG risks and opportunities well, scoring better than the market comparison (see Appendix for more details) in each instance.
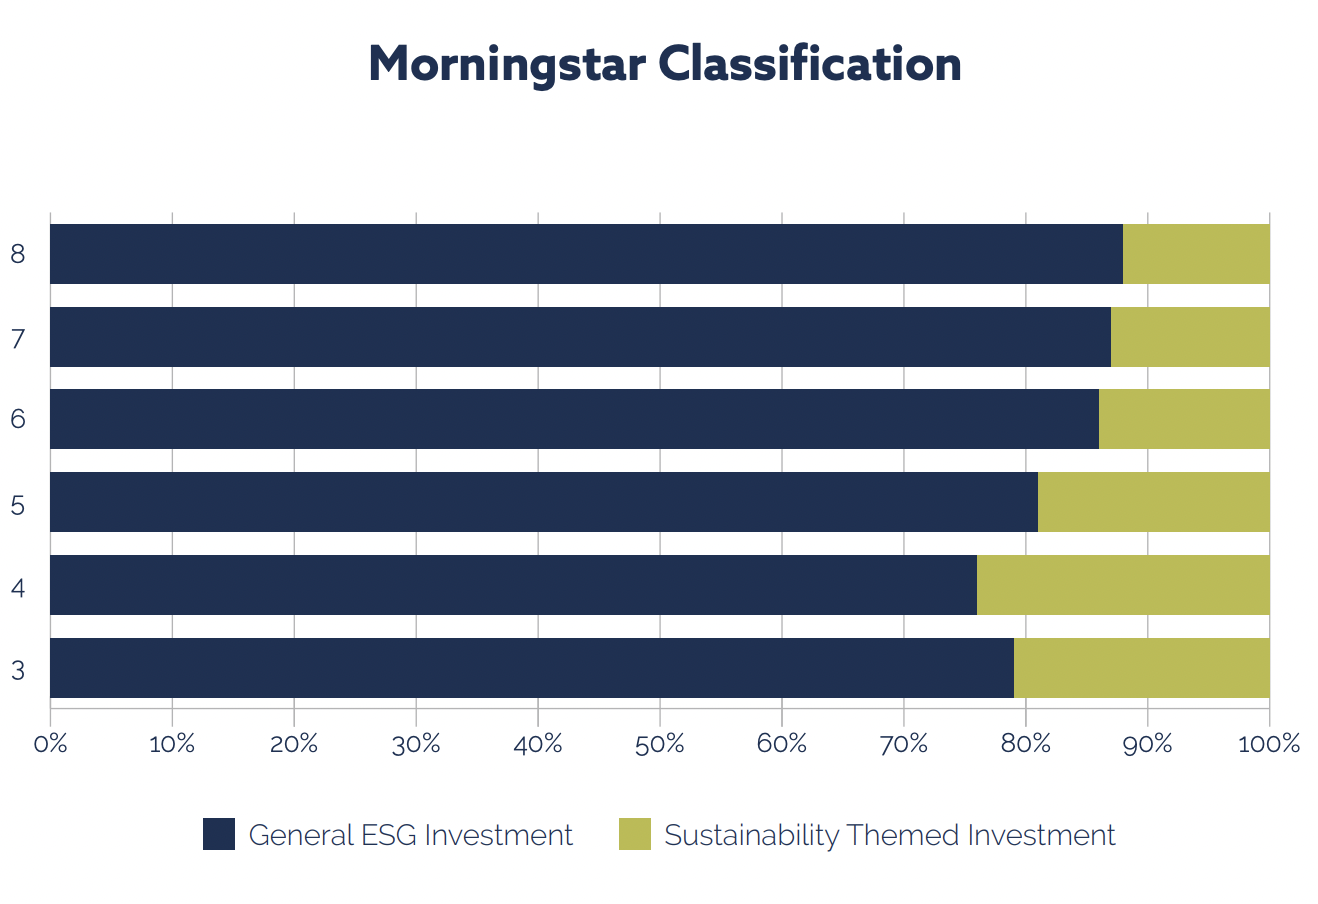
For all of the funds in their database, Morningstar uses things like regulatory filings to distinguish between funds that represent a sustainable allocation of capital and those that do not. Funds that are classified as sustainable are further broken down into two categories: general ESG investment, for funds that integrate ESG data into the portfolio construction and management process, and sustainability themed investments, for funds that additionally target a sustainability theme like climate action or human development.
We can see that all funds held across the proposition are sustainable investments, and most funds are general ESG investments. This makes a good deal of sense, as these funds are far more common than sustainability themed investments.
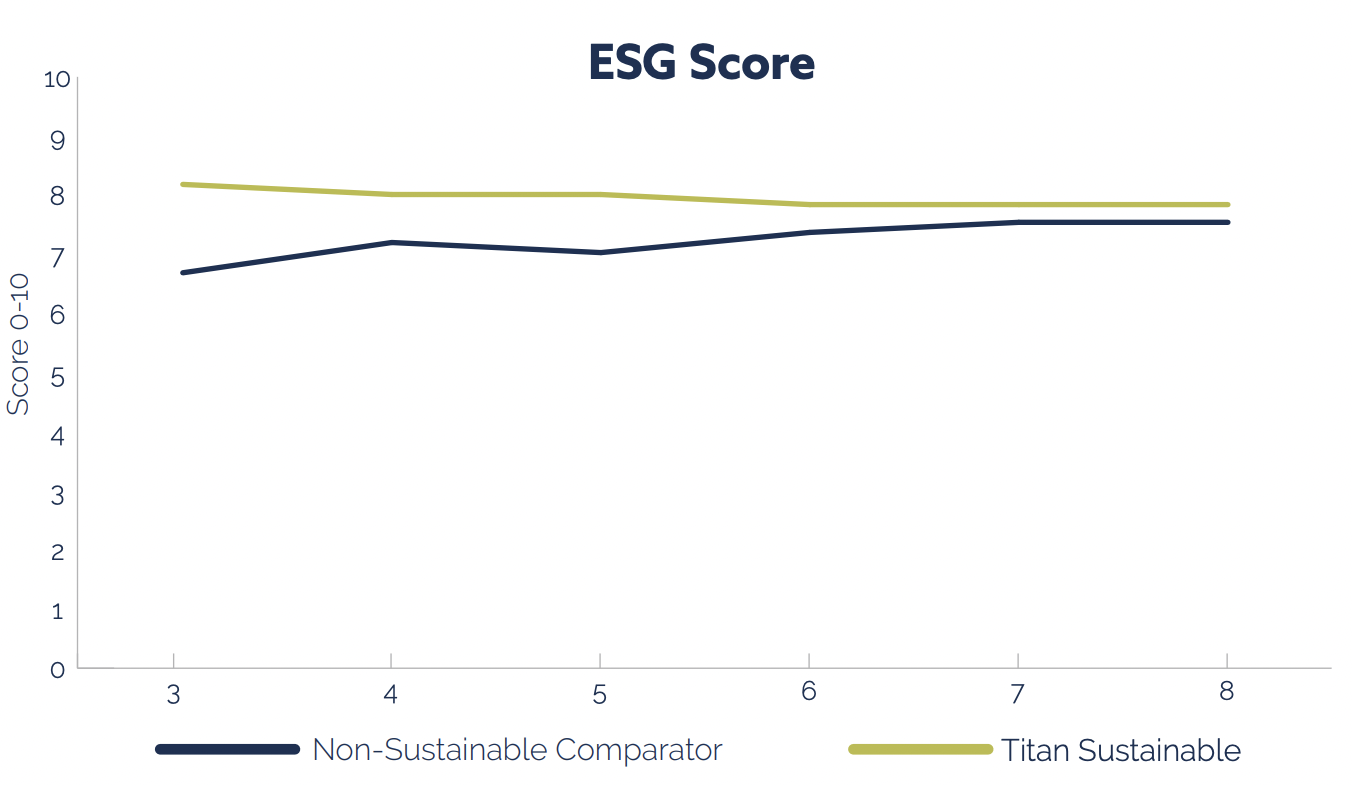
ESG Score
The score is a simple measure of how well key medium- to long-term ESG risks and opportunities are being managed and is measured on a scale of 0 to 10 (worst to best). In each instance, we (green line) achieve a higher score than the market comparison (blue line).
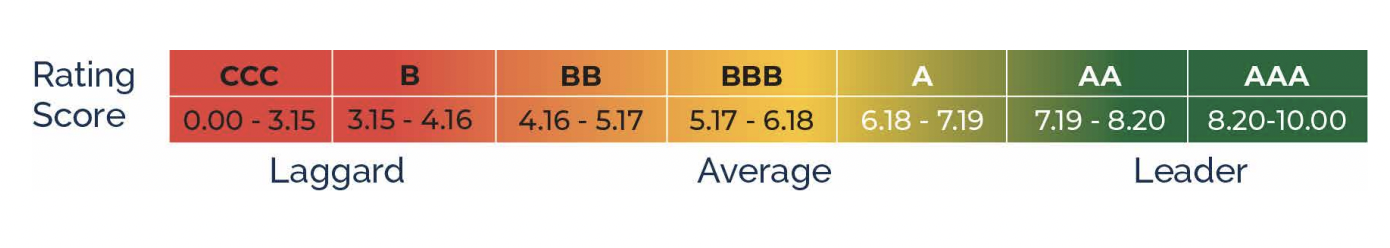
ESG Rating
The rating corresponds to the score (above) and is measured on a scale of CCC to AAA (worst to best). All models achieve an AA rating.
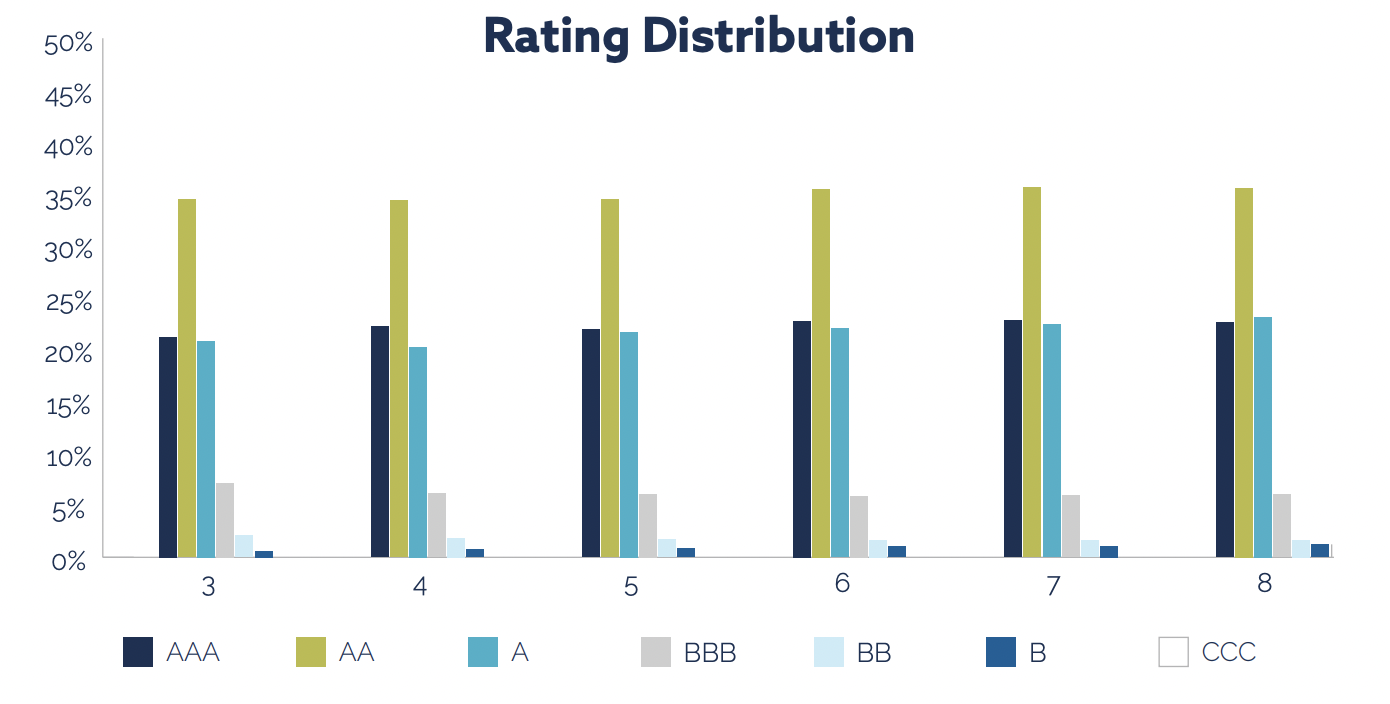
ESG Rating: Distribution
The majority of the underlying holdings across the proposition achieve an A rating or better.
Impact Statistics
The purpose of this section is to explore how the investments held across our proposition, excluding sovereign exposure, are affecting things in the real world. As we explained earlier in the report, impact can be measured across a range of sustainability solutions. Although our proposition does not follow a dual mandate (risk / return plus impact), we believe it is important to measure and communicate this data.
UN Sustainable Development Goal Alignment
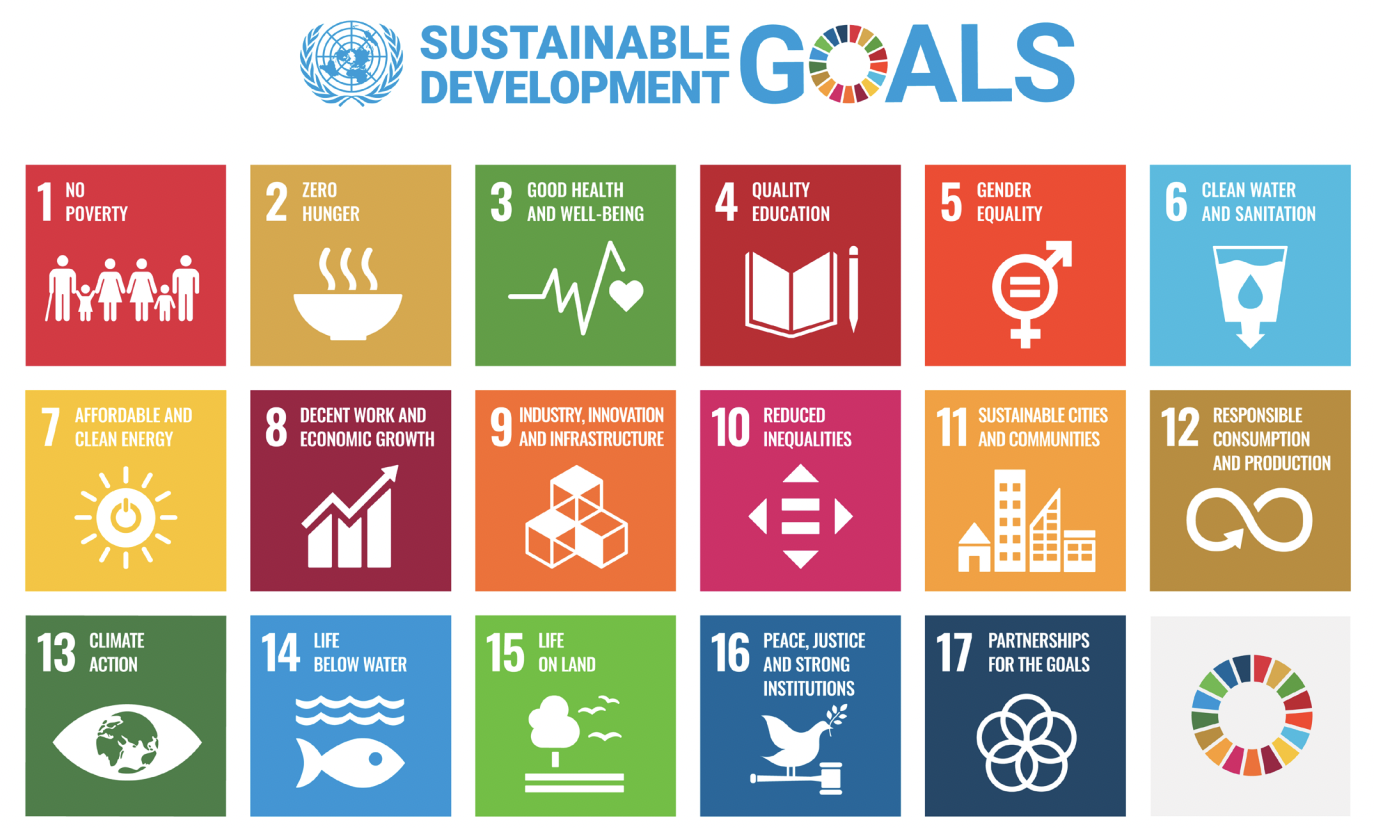
The UN Sustainable Development Goals (SDGs) were adopted by the United Nations’ in 2015 as a universal call to action to end poverty, protect the planet, and ensure that by 2030 all people enjoy peace and prosperity. The SDGs are integrated; they recognize that action in one area will affect outcomes in others, and that development must balance social, economic and environmental sustainability. There are 17 SDGs, which can be mapped to 169 targets and a more granular set of 247 indicators.
The SDGs provide the common language for investors like us to evaluate this real-world impact. Util’s tool relies on natural language processing to disaggregate a company into the constituent products that it sells. These products are than mapped to one or more sustainability concepts drawn from more than 120 million peer-reviewed academic journals.
Once the products have been linked to these concepts, and then to the SDGs, the data can be re-aggregated to the company, then the fund, and finally to the level of our proposition. With the data crunching complete, we are then able see, using a radial chart like the one below, how Titan Sustainable 6 is affecting each of the SDGs.
Risk Statistics
The purpose of this section is to measure and explore the material ESG risk of the proposition, excluding sovereign exposure. Looking at the charts in this section, we can see that the proposition is far less exposed to material ESG risk than the market comparison.
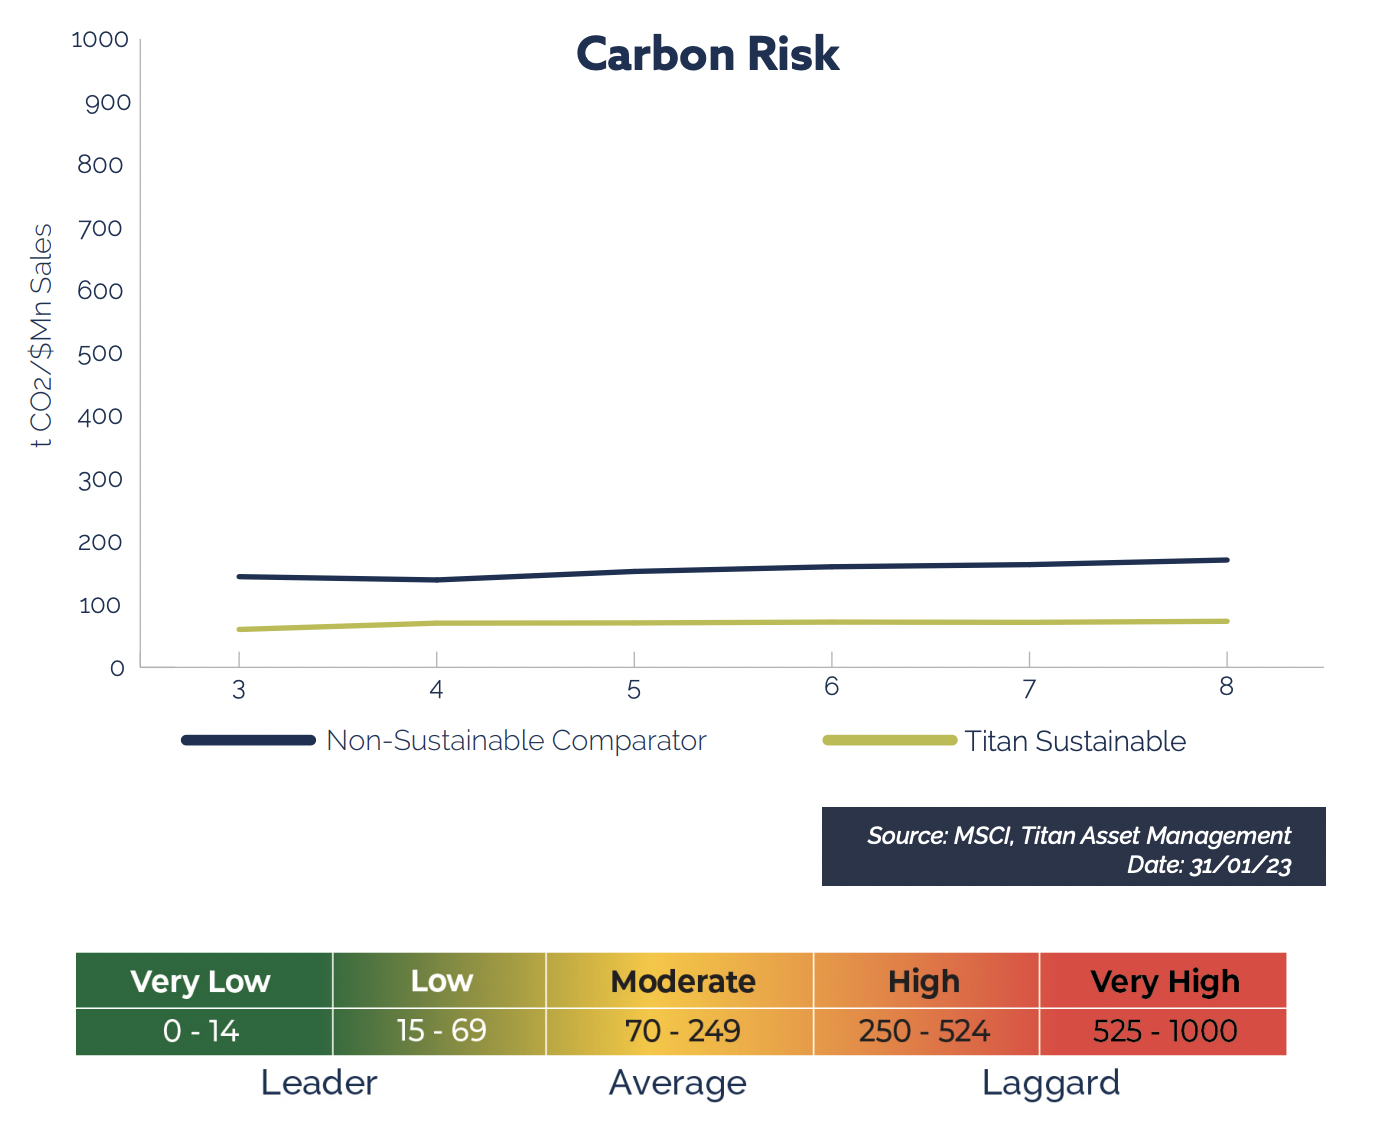
Carbon Risk
Companies which emit lots of carbon dioxide (CO2) are more exposed to carbon-related market and regulatory risks that arise due to climate change. We approximate carbon risk by measuring the carbon intensity of each fund in the proposition, which is the direct plus indirect CO2 emissions of the underlying holdings, divided by sales.
Comparing the green line with the blue line, we can see that the carbon risk of the proposition is significantly less than that of the market comparison (the lower the intensity, the better). For Titan Sustainable 6, carbon risk is more than 50% lower than the market comparison. According to the US Environmental Protection Agency (EPA), per USD1 million invested this reduction is equivalent to the emissions from about 20 petrol-powered passenger vehicles driven for one year.
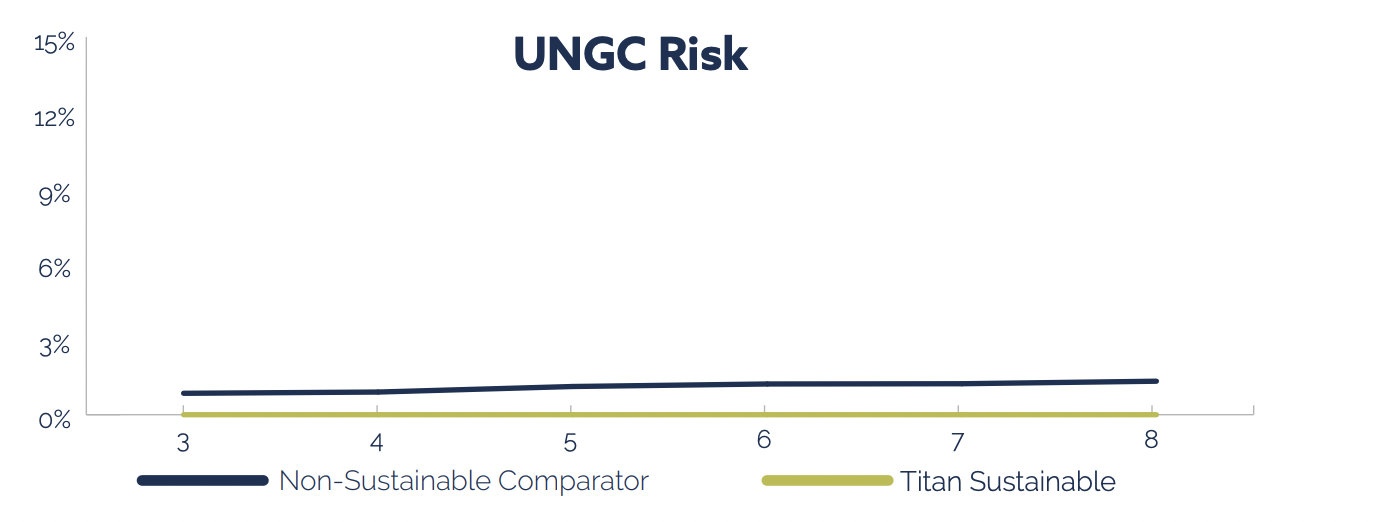
UN Global Compact Risk
There is a spectrum of good and bad actors in every sector and in every country. Measuring exposure to companies in violation of the Ten Principles of the UN Global Compact (see Appendix for more details) is a useful way to separate good actors from bad in a sector- and country-agnostic way (the lower the exposure, the better). The Ten Principles are based on a variety of international declarations and are focused on four areas: human rights, labour, the environment and anti-corruption.
The proposition has no exposure to companies in violation of the Ten Principles, unlike the market comparison, which on average has about 1% exposure.
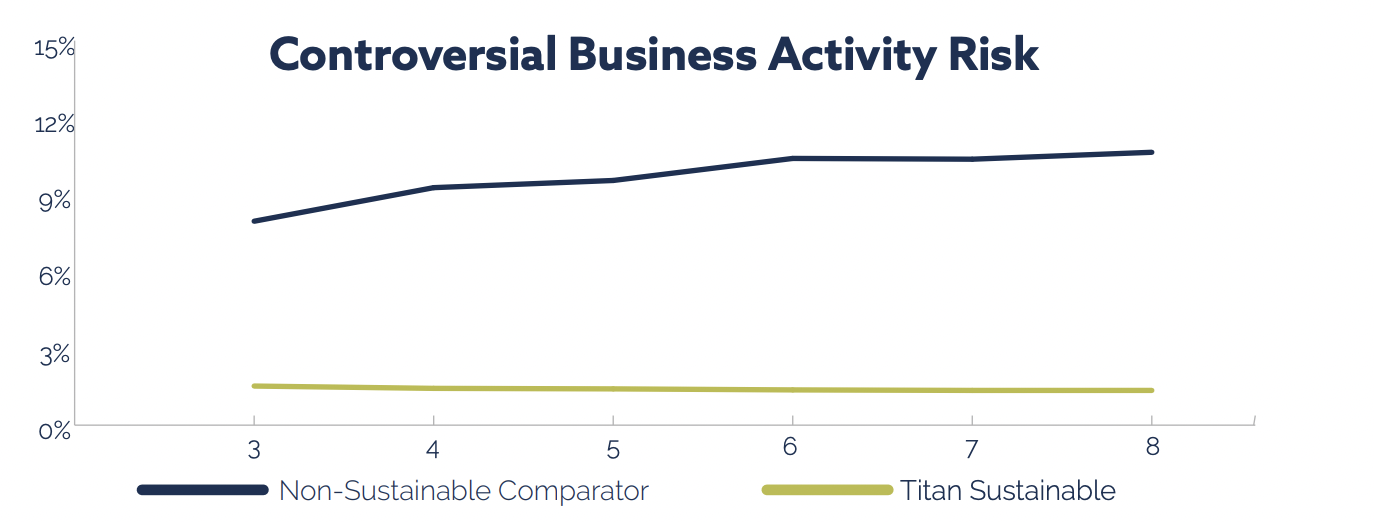
Controversial Business Activity Risk
The aggregated figure represents revenue exposure to a range of controversial business activities: adult entertainment, alcohol, firearms, fossil fuels, gambling, genetic engineering, nuclear, tobacco, weapons. If we compare the green line, our proposition, to the blue line, the market comparison, we see that the proposition is far less exposed to a range of controversial business activities than the market comparison (the lower the figure, the better).

John Leiper
John Leiper is the Chief Investment Officer of Titan Asset Management and carries direct responsibility for all investments in the Centralised Investment Proposition (CIP) at the firm.


Chief Investment Officer, John Leiper, on CNBC 15th December 2023 with Joumanna Bercetche
Titan Asset Management’s CIO discusses the US economy on possible declining interest rates and the soft landing investors may have hoped for, […]