January 2023
Last month we reviewed regulatory developments across the ESG ecosystem in 2022. Now, with fresh market data from Bloomberg and Morningstar, we can review investment product performance and flows for the same calendar period. Measured using a suite of Bloomberg indices, a sustainability-labelled basket of developed market stocks slightly lagged its vanilla peer in 2022. This makes good sense, considering the meaningful outperformance of the energy sector compared to other sectors.
Zooming in a little, the bag becomes a little more mixed. In the US the sustainability-labelled basket also underperformed, but not in Europe where, coincidentally, flows were far more supportive. Indeed, according to Morningstar there were net inflows into European sustainability-labelled funds in each quarter in 2022, totalling about USD 140 billion for the full year.
Conversely, sustainability-labelled funds in the US registered only 2 quarters of net inflows and less than USD 5 billion of net inflows for the full year. A familiar pattern is beginning to emerge. First comes regulation, where Europe (including the UK) is ahead of the US. Then comes flows. A bit like the order of the topics discussed in these commentaries!
February 2023
A common argument against most ESG ratings is that much of the data and assessment behind the ratings is backwards looking. Critics ask, sometimes justifiably, why companies that cause ESG-relevant controversies were, prior to the controversy, either rated positively or included in sustainability-labelled indexes. The ongoing saga involving a sprawling Indian conglomerate, the Adani Group, has been on the whole a welcome rebuttal to this argument.
Adani was recently accused by short-seller Hindenburg Research of multiple red flag controversies including market manipulation and fraud. Though dramatic, this finger pointing at Adani is nothing new. Some ESG ratings providers, including MSCI, have consistently rated several of Adani’s underlying businesses poorly, primarily due to concerns about corporate governance and community relationships. Analysis by Util, another of our data providers, indicates that Adani’s operations are significantly negatively aligned with the UN SDGs.
As a result, even before the short-seller report was published Adani tended to feature less often in sustainability-labelled emerging markets strategies than in the benchmark MSCI EM IMI Index, which has exposure to all of the largest Adani subsidiaries. The case of Adani is, however, not a home run for the ESG ecosystem.
Some data providers were more sanguine than the likes of MSCI in their verdict of the ESG-relevant risks associated with Adani, especially Adani Green Energy, the renewables-focused subsidiary that often features in sustainability-labelled indexes. Perhaps most concerning of all is that Adani, in its response to Hindenburg, pointed to the various sustainability initiatives and frameworks that it has signed up to as evidence that its operations are above board.
March 2023
At first glance, it looks like Larry Fink, the boss of BlackRock, changed his tune on sustainable investing in his most recent annual letter to investors. There were certainly fewer grandiose claims about the investment opportunities associated with the decarbonisation of the global economy.
However, upon further inspection it seems more like Fink has attempted to tone down his rhetoric without changing his convictions, likely in response to the challenging political climate surrounding all things ESG in the USA. To that end, he acknowledged that there are also “attractive investment opportunities… in the traditional space”, whilst maintaining his conviction that “climate risk is an investment risk”.
This exercise in subtility reflects the fact that, after several years of surging popularity, sustainability considerations are now firmly embedded into the capital allocation process, rather than a fleeting trend. Across the pond it is a similar story. The reception to the UK’s green finance strategy, updated on 31/03, was lukewarm. What was at one point labelled ‘Green Day’ morphed into ‘Energy Security Day’ as it became clear that new proposals would not be the “big bazooka” that was hoped for. Although the strategy might not be quite as ambitious as its equivalents in the USA or in Europe, there is good reason to balance the opportunities of greater energy sustainability with the risks of weaker energy security.
Ultimately, as with Fink’s letter, these are small but important steps in the right direction; and all the more welcome in light of a new Intergovernmental Panel on Climate Change (IPCC) report, a summary of the last few years of work by the United Nations (UN) body, which emphasised the urgent need to reduce global emissions in order to avoid missing the goals of the Paris Agreement to limit global warming.
Q2 2023
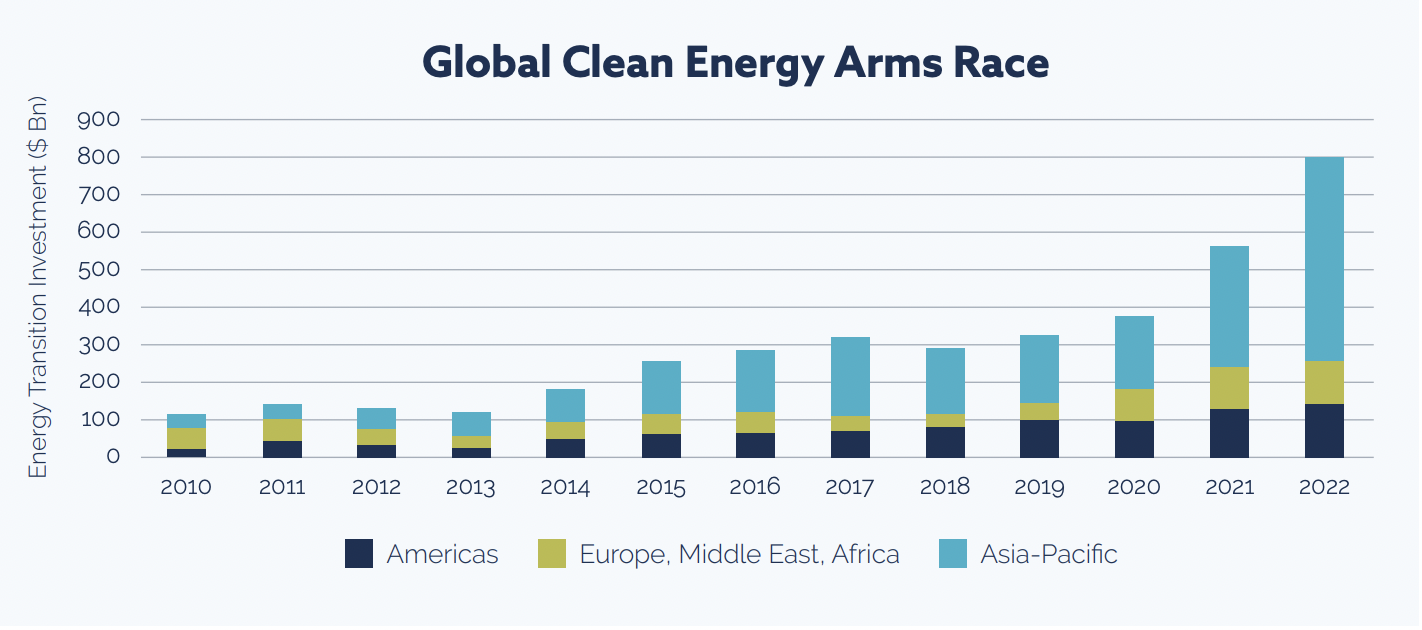
Politicians in Europe used to complain that other parts of the world were lacking in their enthusiasm for decarbonisation. A global clean energy arms race has since begun, and as innovative European companies begin to be lured abroad by more attractive policies and bigger subsidies, it seems that, for these politicians, it is a case of ‘be careful what you wish for’.
Due to the Inflation Reduction Act, signed into law last year, the USA has leapfrogged from a laggard to a leader in this race. The prioritisation of carrots (easy-access subsidies) rather than sticks (regulation and taxes) has been the catalyst for a shift in the epicentre of global efforts to decarbonise away from Europe. This shift is all the more remarkable considering that, unlike in Europe where most consumers are ideologically onboard with the transition away from fossil fuels, in the USA there remains a distinct divide between clean energy advocates and critics, mostly along political lines (ironically, most of the IRA-induced investment so far has been in Republican-controlled states).
The risk for the Europe is that, without supportive policy, innovation in this space will continue to move away, leaving the ‘old continent’ long on demand for decarbonisation tools but short on domestic supply. Leaders in Europe are certainly cognizant of this risk, explaining why the European Commission recently announced the Net Zero Industry Act, part of the European Green Deal Industrial Plan.
However, the growing rivalry between leaders on either side of the Atlantic (including the UK, where bold claims have yet to really be backed up with bold government policy or, importantly, cash) is a bit of a moot point. As the chart below shows, at present it is a squabble over second place. According to Bloomberg New Energy Finance (BNEF), a powerful combination of “lower costs, technological know-how and favourable regulation” means that it will be both difficult and expensive for Western economies to reduce reliance on China for their clean energy supply chains.
For example, BNEF estimate that the CapEx required to build a solar factory in the US or Europe is 3x higher than in China. Regardless of which countries emerge victorious in the global clean energy arms race over the long-term, the fact that there is now a race is a good thing from a climate perspective. We continue to have broad, diversified exposure to this sub-asset class across our sustainable investment proposition.
High Level Statistics
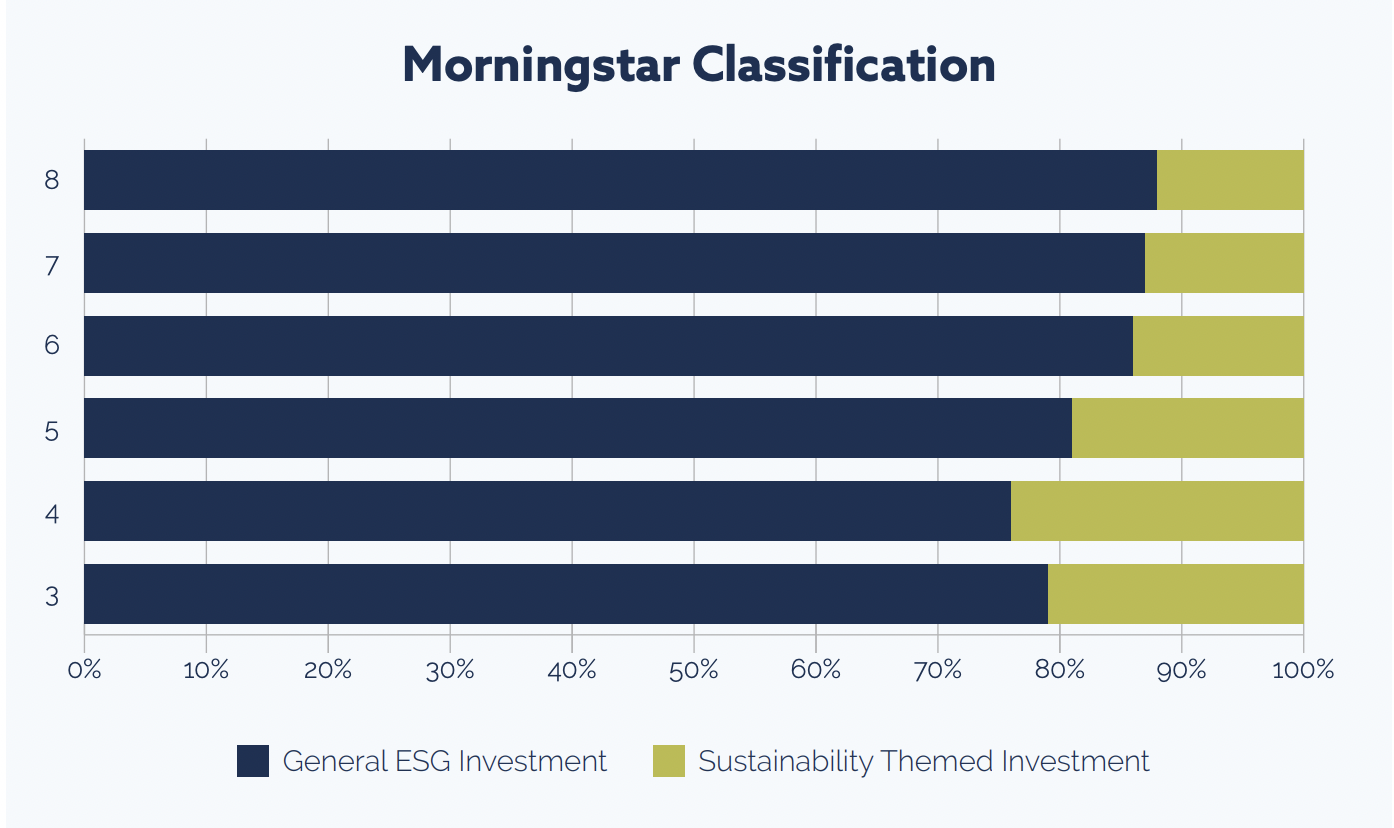
Morningstar Classification
For all of the funds in their database, Morningstar uses things like regulatory filings to distinguish between funds that represent a sustainable allocation of capital and those that do not. Funds that are classified as sustainable are further broken down into two categories: general ESG investment, for funds that integrate ESG data into the portfolio construction and management process, and sustainability themed investments, for funds that additionally target a sustainability theme like climate action or human development.
We can see that all funds held across the proposition are
sustainable investments, and most funds are general ESG investments. This makes a good deal of sense, as these funds are far more common than sustainability themed investments.
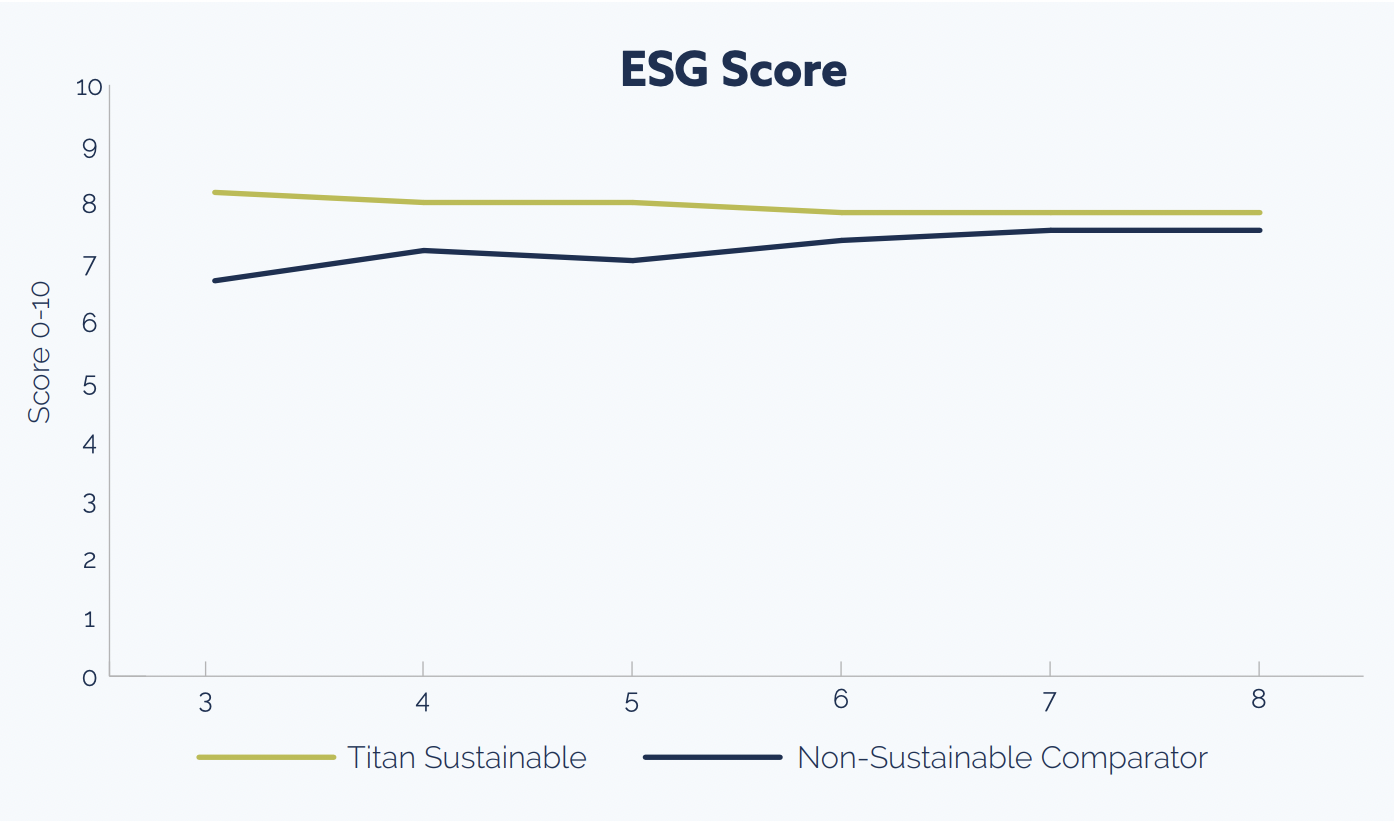
ESG Score
The score is a simple measure of how well key medium- to long-term ESG risks and opportunities are being managed and is measured on a scale of 0 to 10 (worst to best). In each instance, we (green line) achieve a higher score than the market comparison (blue line).
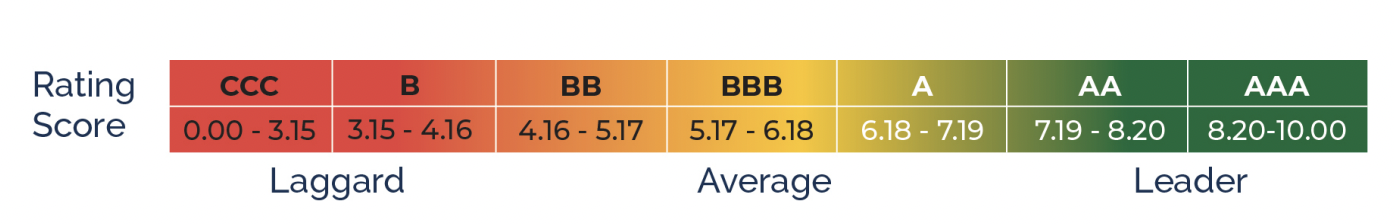
ESG Rating
The rating corresponds to the score (above) and is measured on a scale of CCC to AAA (worst to best). All models achieve an AA rating.
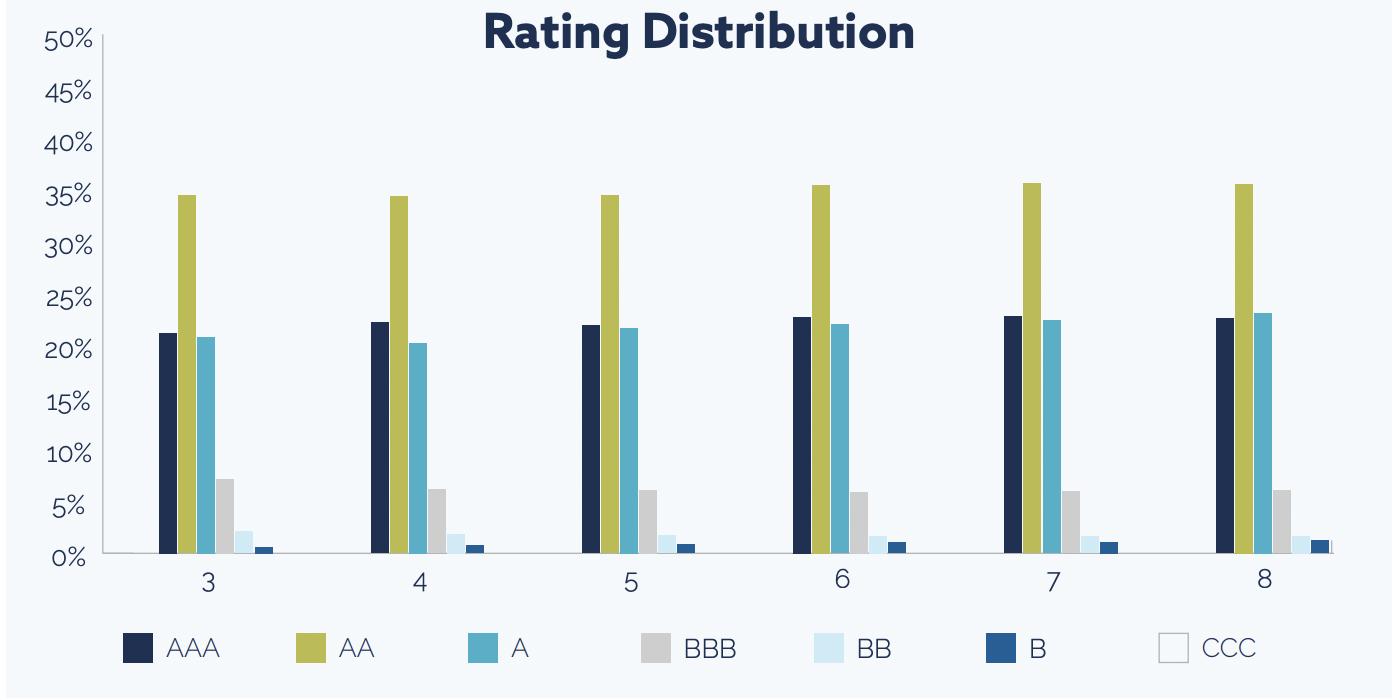
ESG Rating: Distribution
The majority of the underlying holdings across the proposition achieve an A rating or better
Impact Statistics
The purpose of this section is to explore how the investments held across our proposition, excluding sovereign exposure, are affecting things in the real world. As we explained earlier in the report, impact can be measured across a range of sustainability solutions.
Although our proposition does not follow adual mandate (risk / return plus impact), we believe it is important to measure and communicate this data.
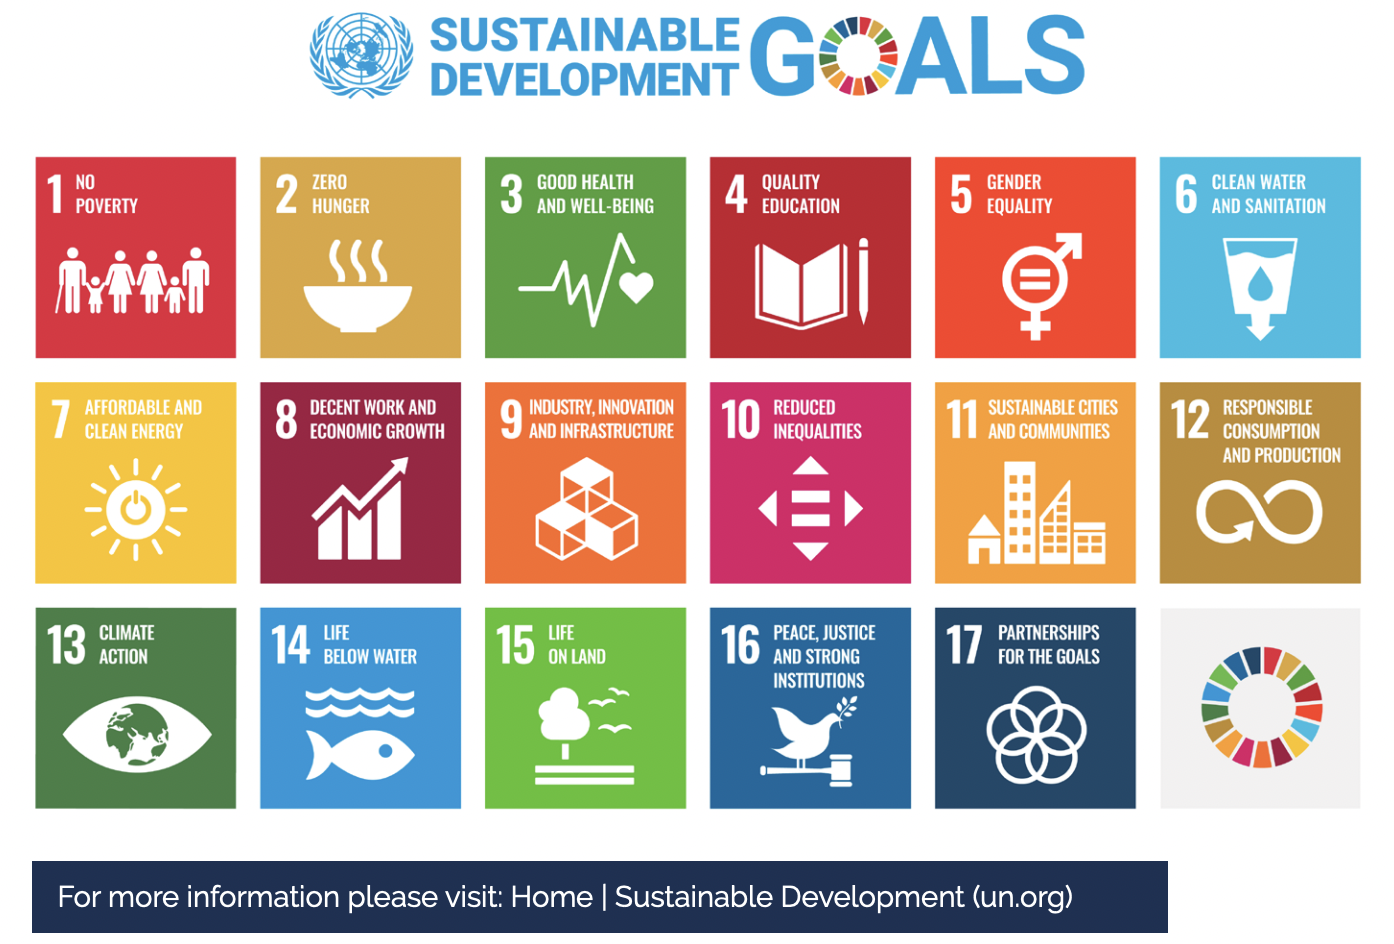
UN Sustainable Development Goal Alignment
The UN Sustainable Development Goals (SDGs) were adopted by the United Nations’ in 2015 as a universal call to action to end poverty, protect the planet, and ensure that by 2030 all people enjoy peace and prosperity. The SDGs are integrated; they recognise that action in one area will affect outcomes in others, and that development must balance social, economic and environmental sustainability. There are 17 SDGs, which can be mapped to 169 targets and a more granular set of 247 indicators.
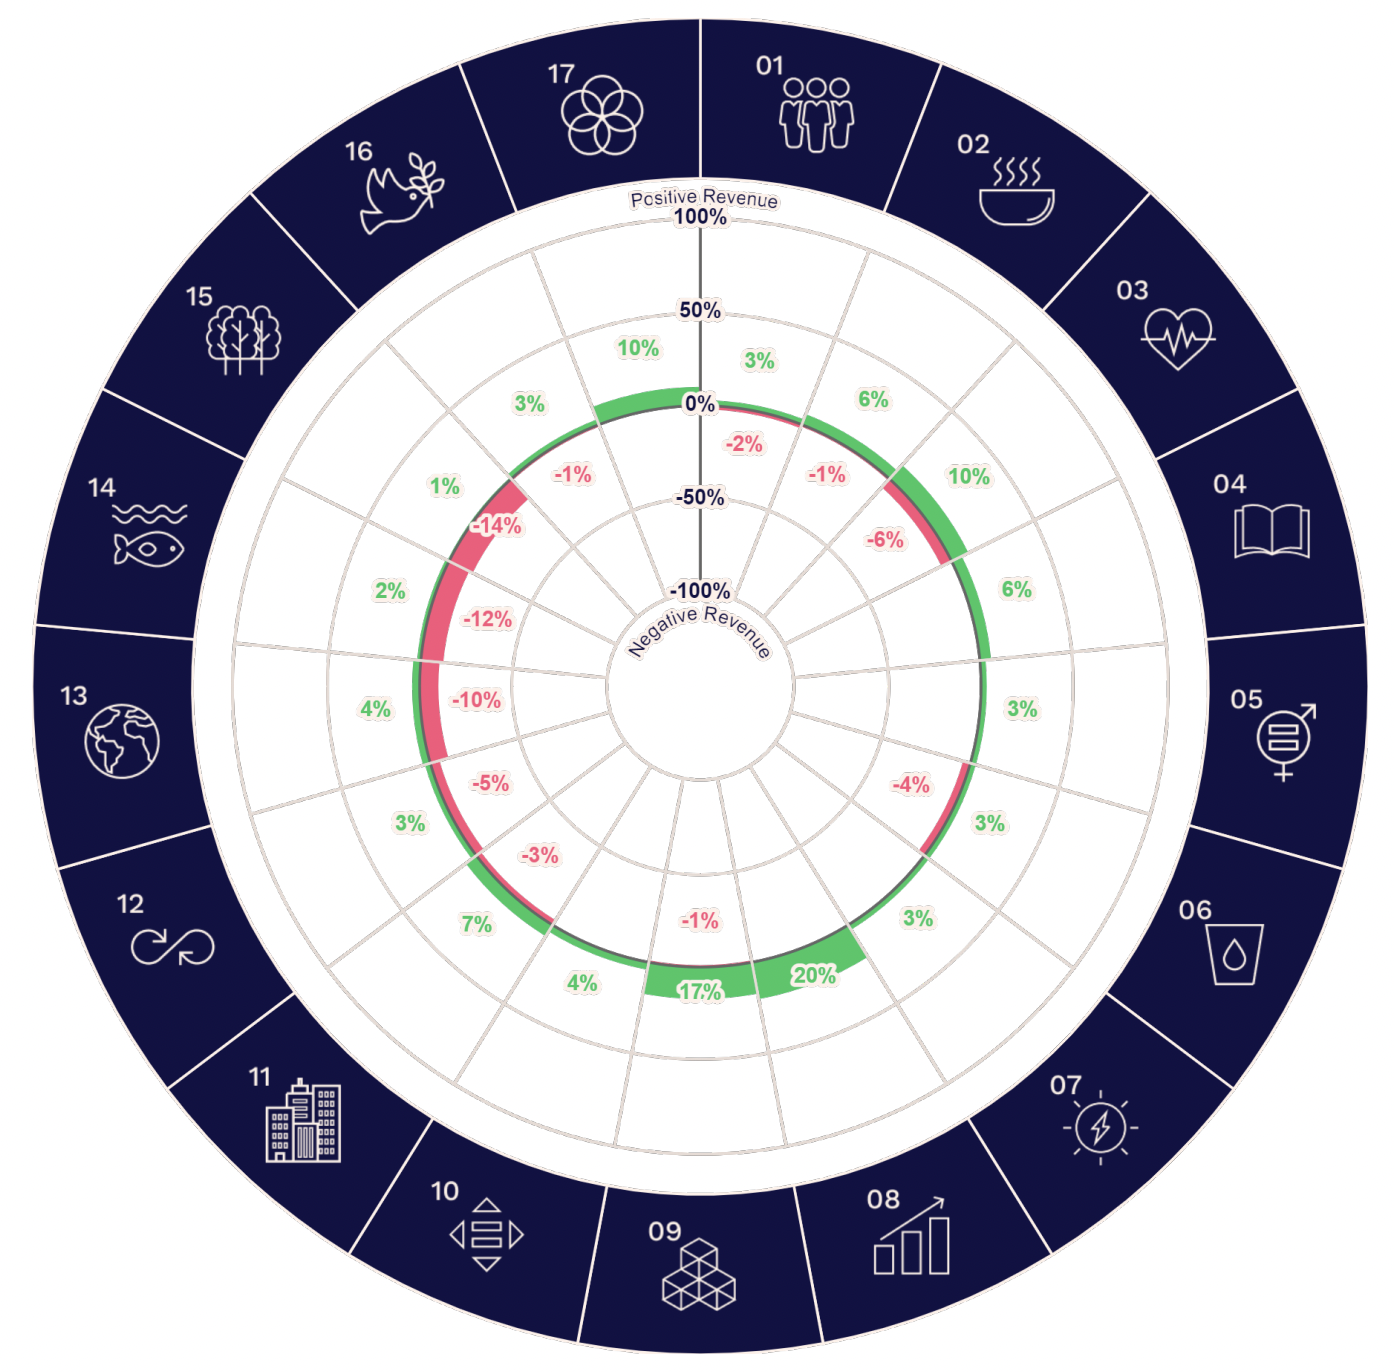
The SDGs provide the common language for investors like us to evaluate this real-world impact. Util’s tool relies on natural language processing to disaggregate a company into the constituent products that it sells. These products are than mapped to one or more sustainability concepts drawn from more than 120 million peer-reviewed academic journals.
Once the products have been linked to these concepts, and then to the SDGs, the data can be re-aggregated to the company, then the fund, and finally to the level of our proposition. With the data crunching complete, we are then able see, using a radial chart like the one below, how Titan Sustainable 6 is affecting each of the SDGs.
Risk Statistics
The purpose of this section is to measure and explore the material ESG risk of the proposition, excluding sovereign exposure. Looking at the charts in this section, we can see that the proposition is far less exposed to material ESG risk than the market comparison.
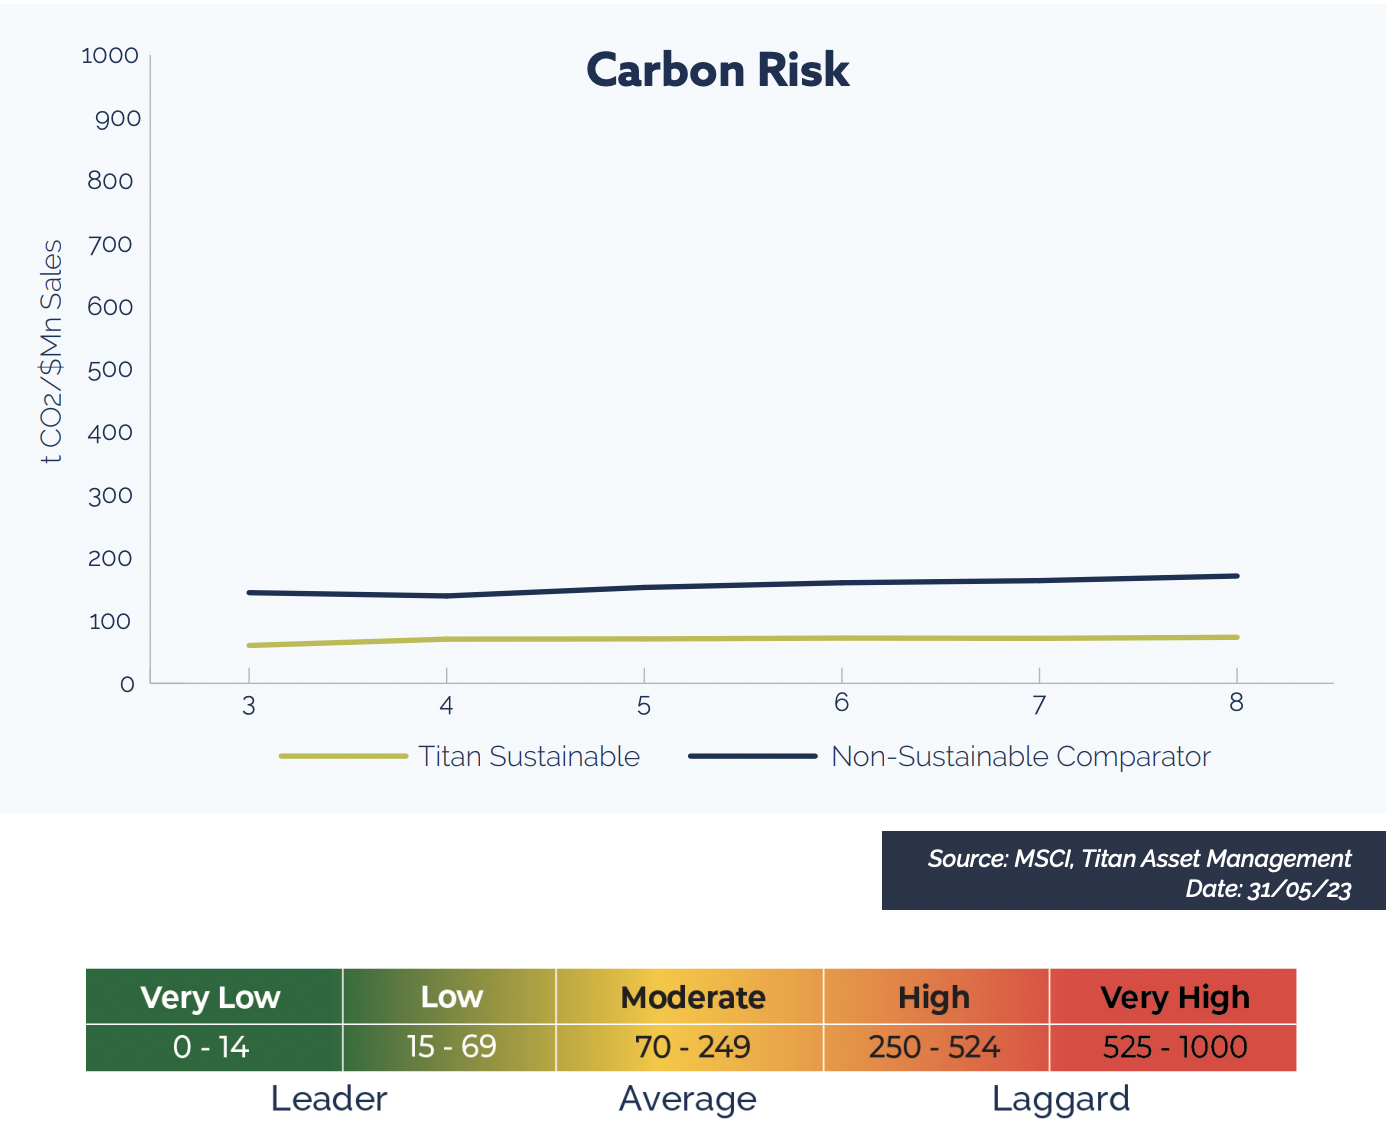
Carbon Risk
Companies which emit lots of carbon dioxide (CO2) are more exposed to carbon-related market and regulatory risks that arise due to climate change. We approximate carbon risk by measuring the carbon intensity of each fund in the proposition, which is the direct plus indirect CO2 emissions of the underlying holdings, divided by sales.
Comparing the green line with the blue line, we can see that the carbon risk of the proposition is significantly less than that of the market comparison (the lower the intensity, the better). For Titan Sustainable 6, carbon risk is about 50% lower than the market comparison. According to the US Environmental Protection Agency (EPA), per USD1 million invested this reduction is equivalent to the emissions from about 15 petrol-powered passenger vehicles driven for one year.
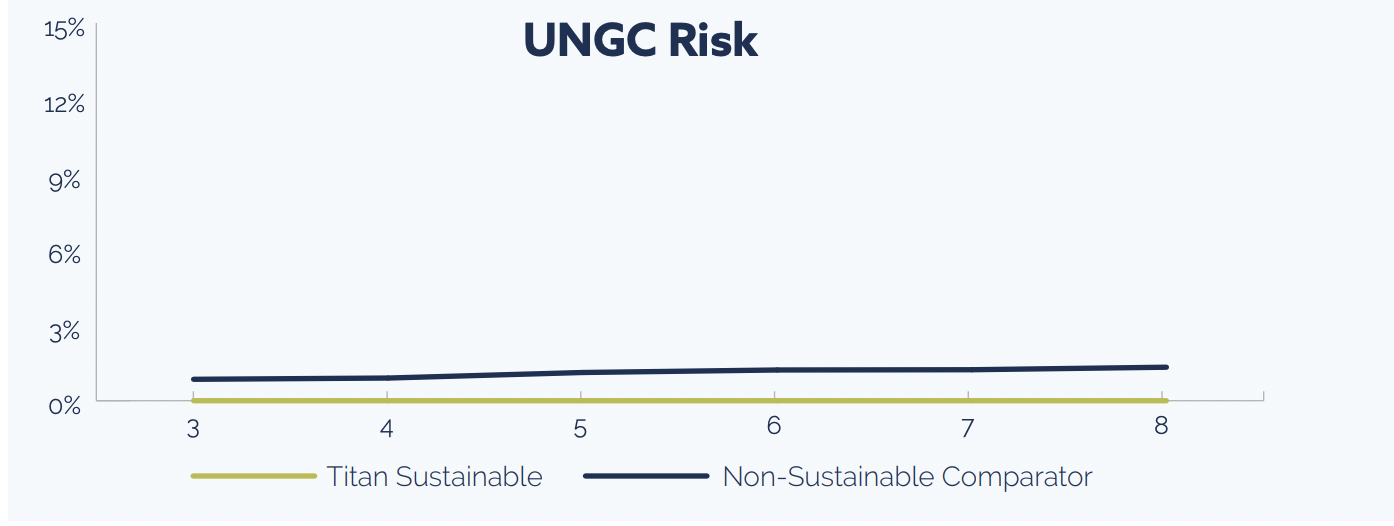
UN Global Compact Risk
There is a spectrum of good and bad actors in every sector and in every country. Measuring exposure to companies in violation of the Ten Principles of the UN Global Compact (see Appendix for more details) is a useful way to separate good actors from bad in a sector- and country-agnostic way (the lower the exposure, the better).
The Ten Principles are based on a variety of international declarations and are focused on four areas: human rights, labour, the environment and anti-corruption. The proposition has no exposure to companies in violation of the Ten Principles, unlike the market comparison, which on average has about 1% exposure.
Controversial Business Activity Risk
The aggregated figure represents revenue exposure to a range of controversial business activities: adult entertainment, alcohol, firearms, fossil fuels, gambling, genetic engineering, nuclear, tobacco, weapons. If we compare the green line, our proposition, to the blue line, the market comparison, we see that the proposition is far less exposed to a range of controversial business activities than the market comparison (the lower the figure, the better).


James Peel


Rotations & dividends
Back in November 2020 I wrote a blog, Nothing Is More Powerful Than An Idea Whose Time Has Come, in which I […]