Markets are especially choppy at the moment so we thought it would be a good time to take a step back and explain some of the more quantitative measures we use to cut through human bias and keep a fresh perspective on markets. At Titan Asset Management one of the key parts of our investment approach is quantitative risk management. We believe the use of such techniques can help to improve the overall risk/return of the portfolios as well as highlight new investment opportunities. In this blog, I will explain some of these practices and how we use them to help make investment decisions.
One of the techniques we use is technical analysis. Technical analysis is the method of evaluating financial markets by analyzing statistical trends and patterns of price and volume data of securities. It relies on the use of charts and other quantitative tools to identify patterns, such as support and resistance levels, trendlines, and technical indicators, which can provide insights into the direction of price movements and potential entry and exit points for trades. Technical analysis is predicated on the belief that market movements are not entirely random and that historical price and volume data can provide valuable information about future price movements.
At Titan Asset Management we use both technical analysis alongside fundamental analysis, which evaluates the financial and economic factors that underpin the value of a security. Together, technical and fundamental analysis helps to provide the investment team with a comprehensive view of the market, increasing the probability that our investment ideas add value, or reduce risk, across the proposition.
Let’s discuss an example. Back in 2020, the scale of global stimulatory policy became a clear focus point as we, like others, assessed what this shift in fiscal and monetary policy would mean for wider markets. One of our core views at that time was the idea of a commodity carve-out which we felt would outperform a traditional portfolio comprising equities and bonds. To set the scene, please find below a chart and brief explanatory exert from the original blog we wrote at the time, which you can read here.
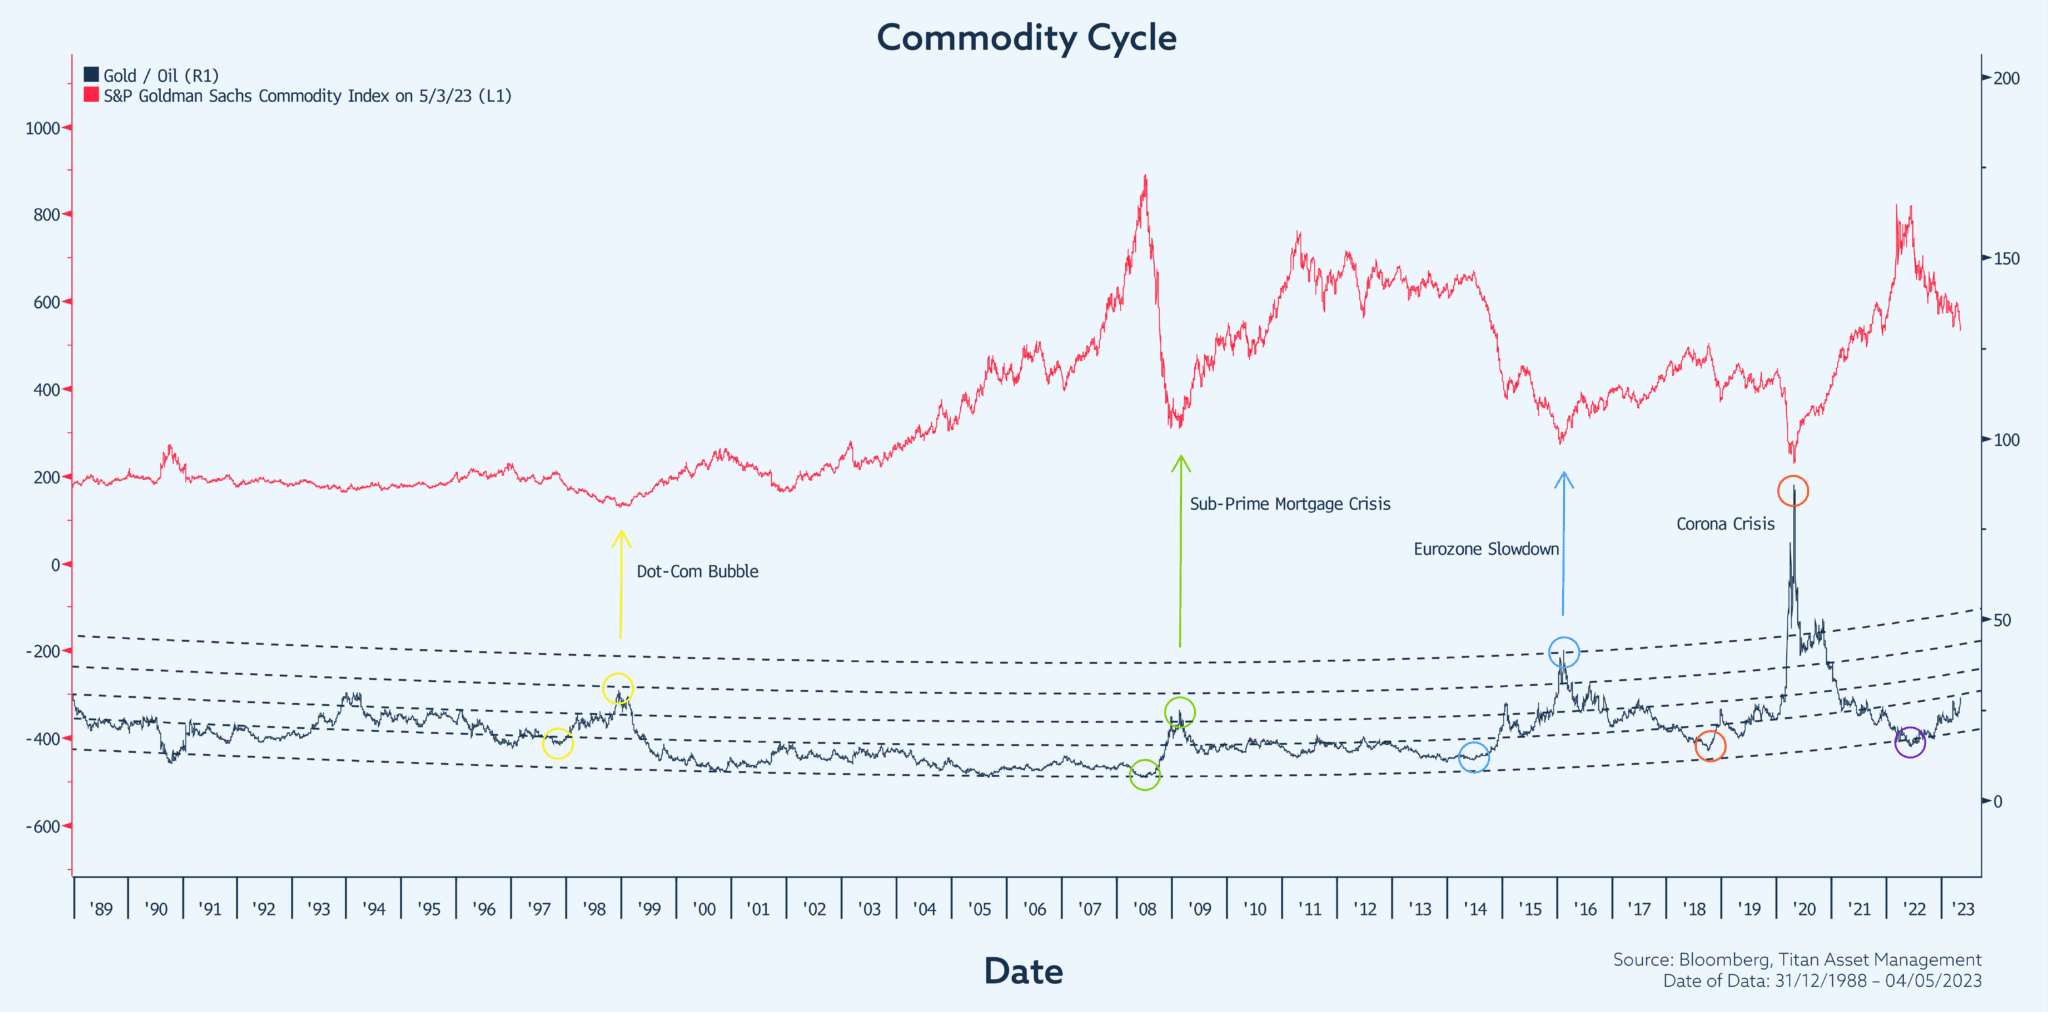
“Since 1997, there have been four phases where the gold/oil ratio has climbed from below the solid white line to a substantial peak above. These phases are identified by the coloured circles which represent the dot-com bubble, sub-prime mortgage crisis, eurozone slowdown and current corona crisis. The first circle in each phase represents peak-inflationary-optimism… the “pride before the fall”. The second circle in each phase represents peak-deflationary-pessimism… that “down and out” feeling you get at market bottoms. In each instance, when moving from the first circle to the second, gold has outperformed oil as fear rises and risk aversion sets in. We participated in the most recent move via our allocation to both physical gold and commodity equities in the gold mining sector.
Moving past the second circle represents renewed optimism as markets price in economic recovery. This is currently the case and consistent with oil outperforming gold.
The key takeaway from this chart is that the “down and out” second circle, which we have now passed, has consistently flagged the bottom in commodity markets in each of the last three phases. As such, now is the time to carve-out a specific allocation to commodities across multi-asset class portfolios.”
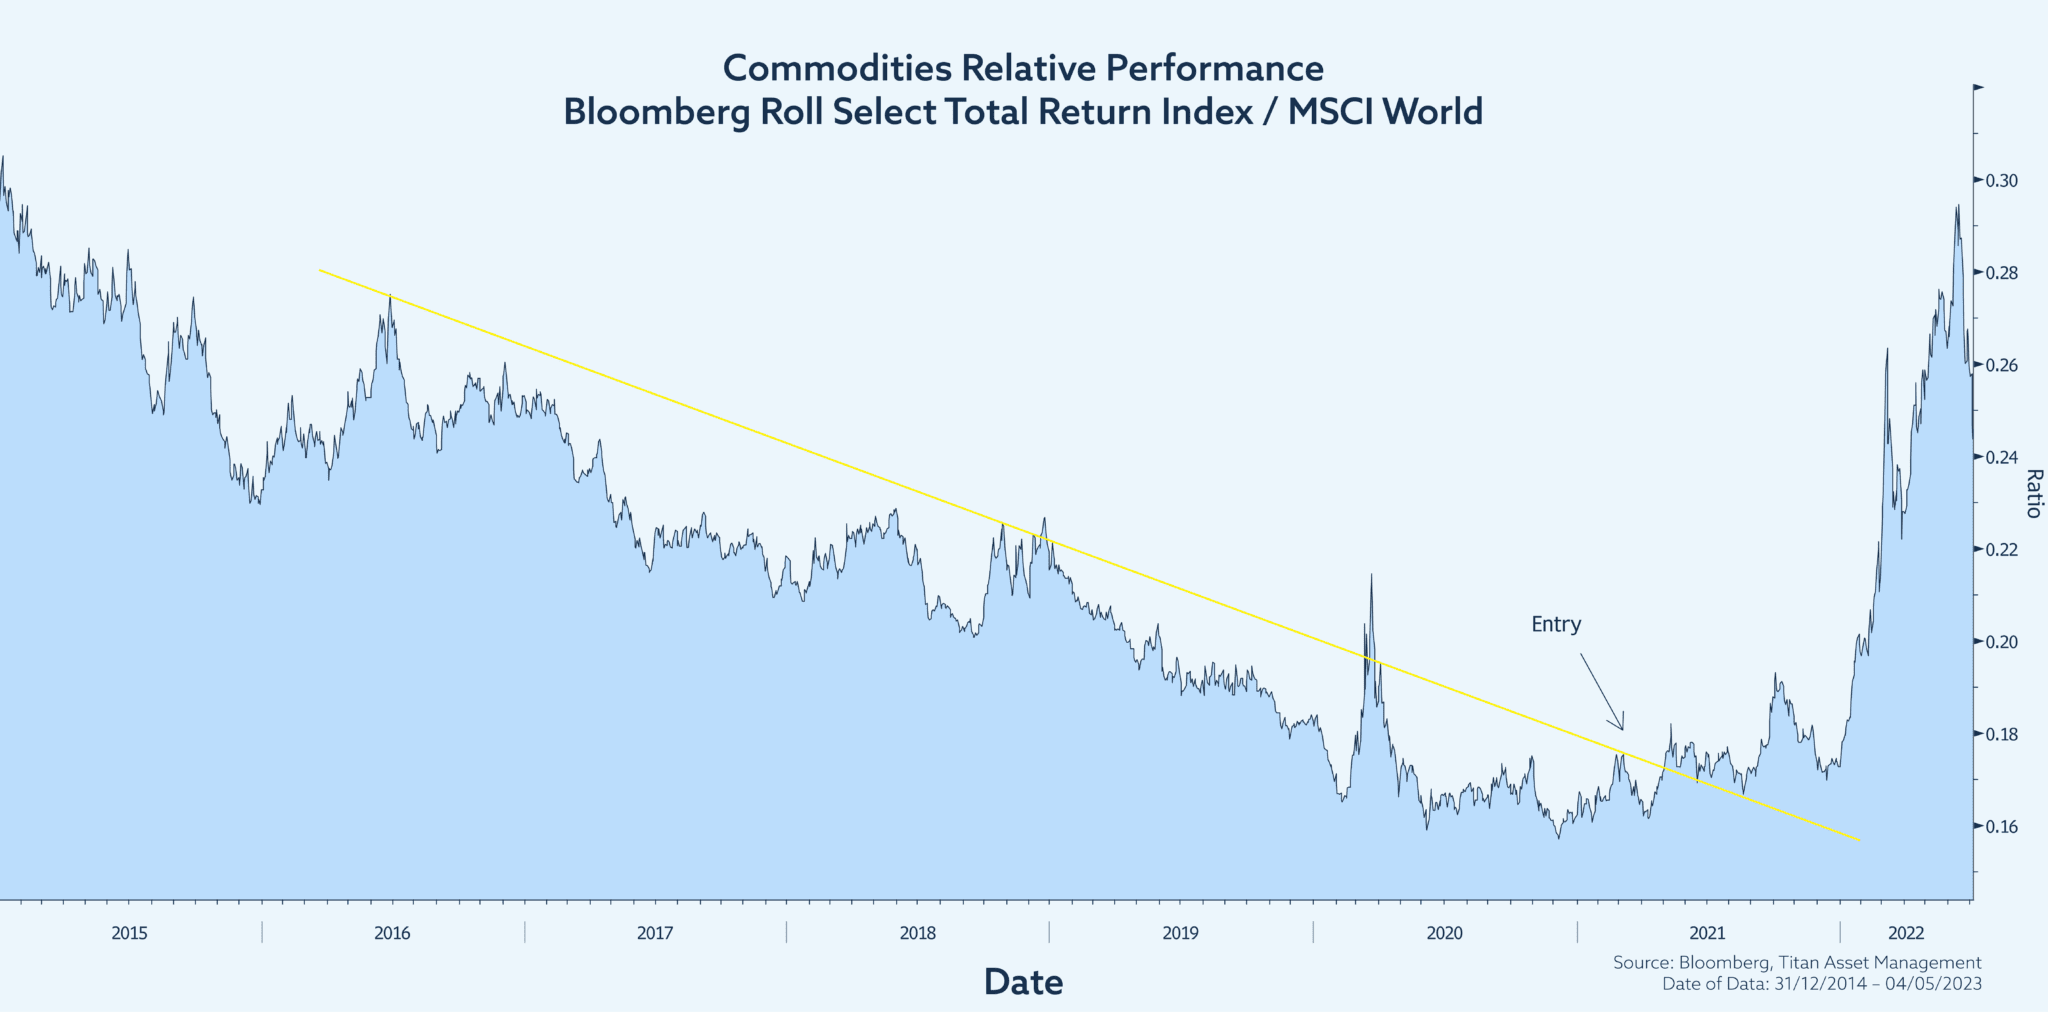
Having established a potential opportunity in commodities, we then turned to relative value technicals to further assess the viability of this trade idea. The chart below shows the relative performance of a diversified commodity swap ETF versus the global equity index, MSCI World. Towards the end of 2021, commodities started to outperform equities, as demonstrated by a clear break of the prior downward-sloping channel. This breakout was a bullish indicator highlighting a clear change in market sentiment.
With the fundamentals and technicals aligned we opened a new position across the ACUMEN Portfolios. This preceded a sharp rise in the price of commodities as supply bottlenecks met resurgent demand.
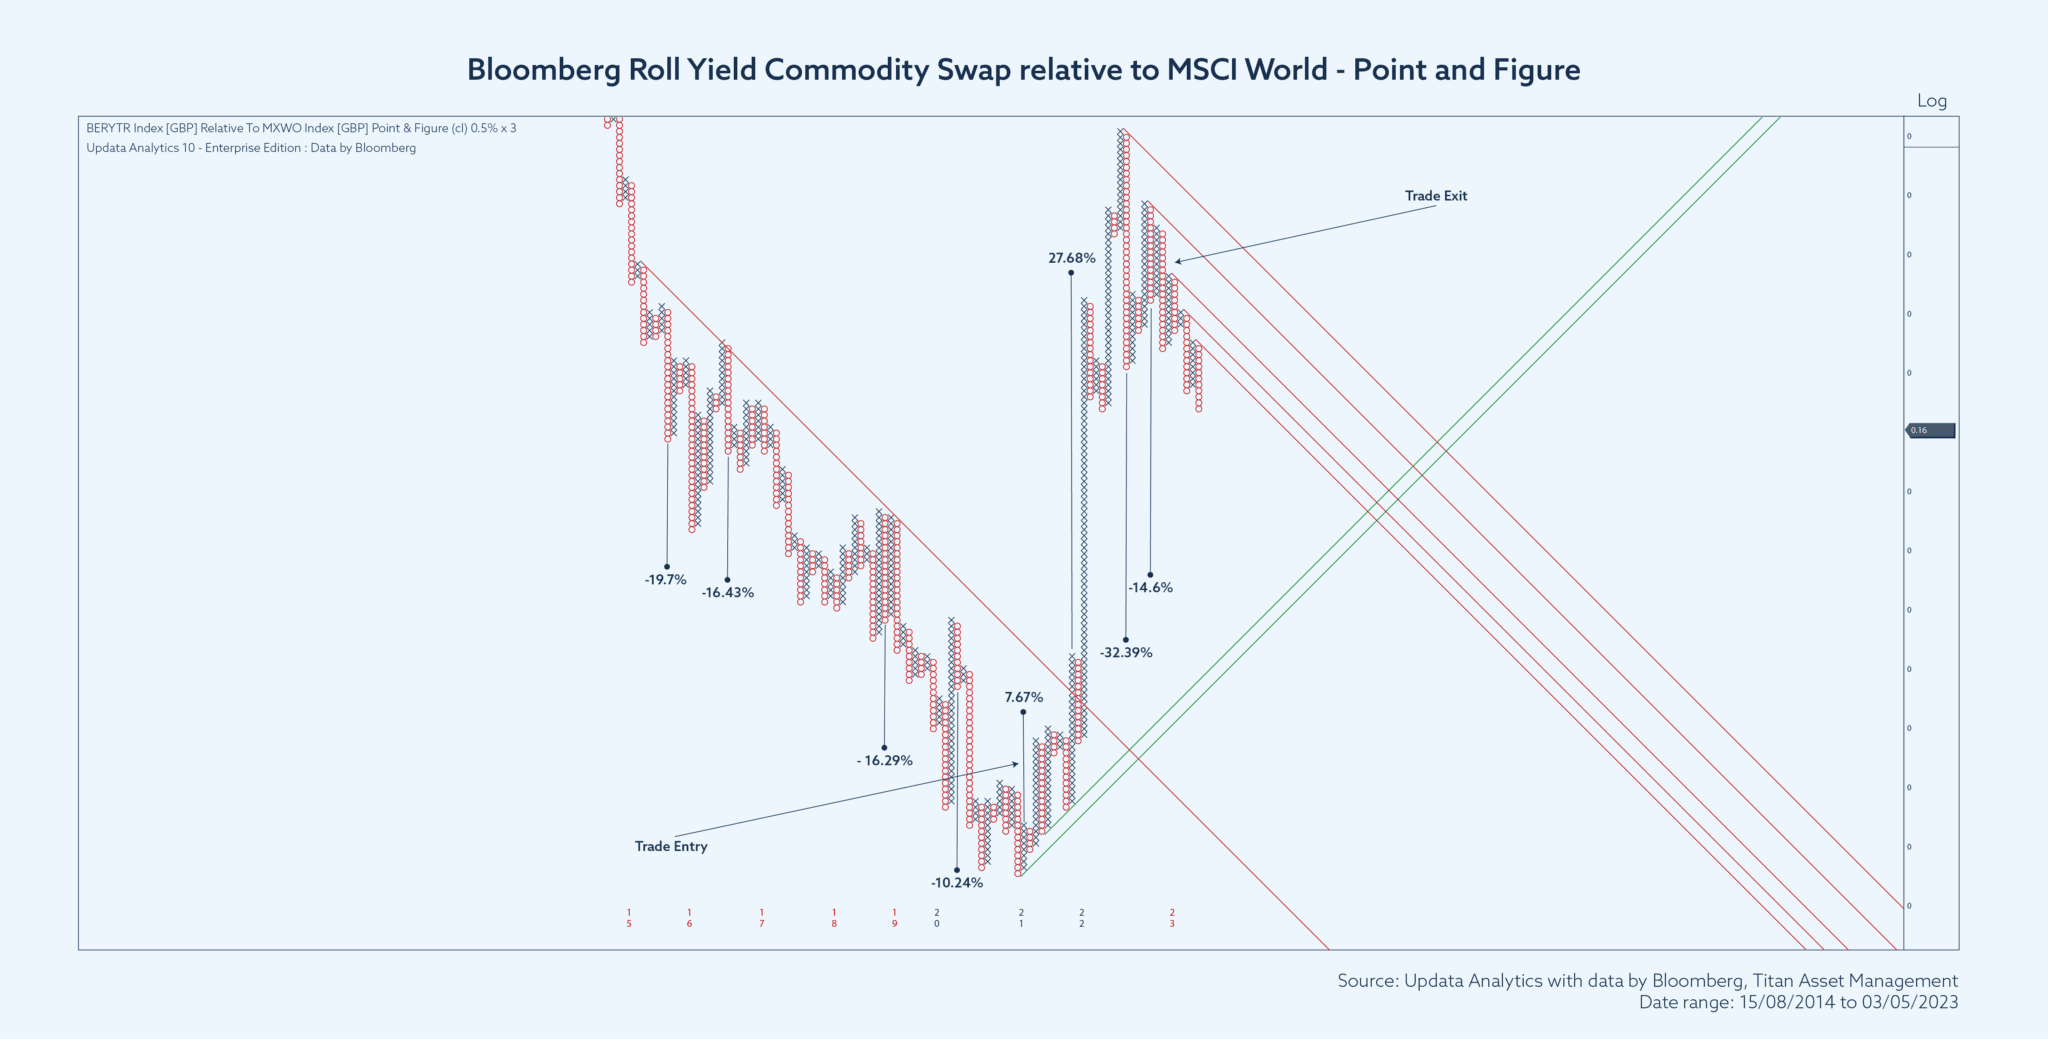
One of the other tools we now use is point and figure charting. Although these charts may look confusing at first glance, point and figure is useful as it strives to strip out market volatility to show the underlying trends. It does so by selecting a box size, with a blue X indicating an upward move, of a prescribed magnitude, and a red O indicating a downward move of the same size.
The horizontal axis is not based on time, rather a new X or O appears each time the security moves by the specified amount. Moves below that threshold level are effectively screened out. One of the clear use cases of point and figure analysis is the ability to set targets which we can trade to, optimizing returns and better managing position-specific risk. With that in mind, the chart below shows the same relative performance of commodities versus equities, in point and figure format.
Following the break-out in relative performance, establishing a new uptrend, a series of upside targets were established (with around 28% upside from levels at the time), which became our profit target for the trade.
Fast forward to late 2022, and having reached our profit target, we then re-evaluated the position to determine the next steps. As discussed in our Q4 Quarterly Perspectives, we became increasingly pessimistic in our assessment of the market outlook, with inflation peaking and growing recessionary risks following the lagged impact of prior rate hikes.
Referring to the very first chart, we noticed that the gold/oil ratio had fallen to the bottom of the channel. This ‘first circle’ in a new cycle suggested that commodity prices had likely peaked and may fall moving forward. Further, it implied a potential rotation out of cyclicals and into precious metal commodities, like gold.
From a technical perspective, on the relative value chart which we have updated to the present day (below), we observed a clear head and shoulders pattern pointing to further downside risk. On a clear break of the neck-line we exited the position booking a sizeable profit on the trade. Since exiting the trade, commodities have gone on to underperform equities, coinciding with the clear downside targets set on the point and figure chart.

The updated relative value chart shows a head and shoulders pattern pointing to further downside risk on the break of the neckline. subsequent breakdown in risk sentiment and catalyst for our decision to exit the trade.
We have exited broad-based commodities, but we retain exposure to gold, which we continue to like (you can read about in more detail in our prior blog Time for Gold To Shine). Technically, however, we are at a key level near all-time highs and at a potential resistance level the yellow metal has struggled to break through on three prior occasions. We think this time is different, but as always, we continue to monitor the position closely.
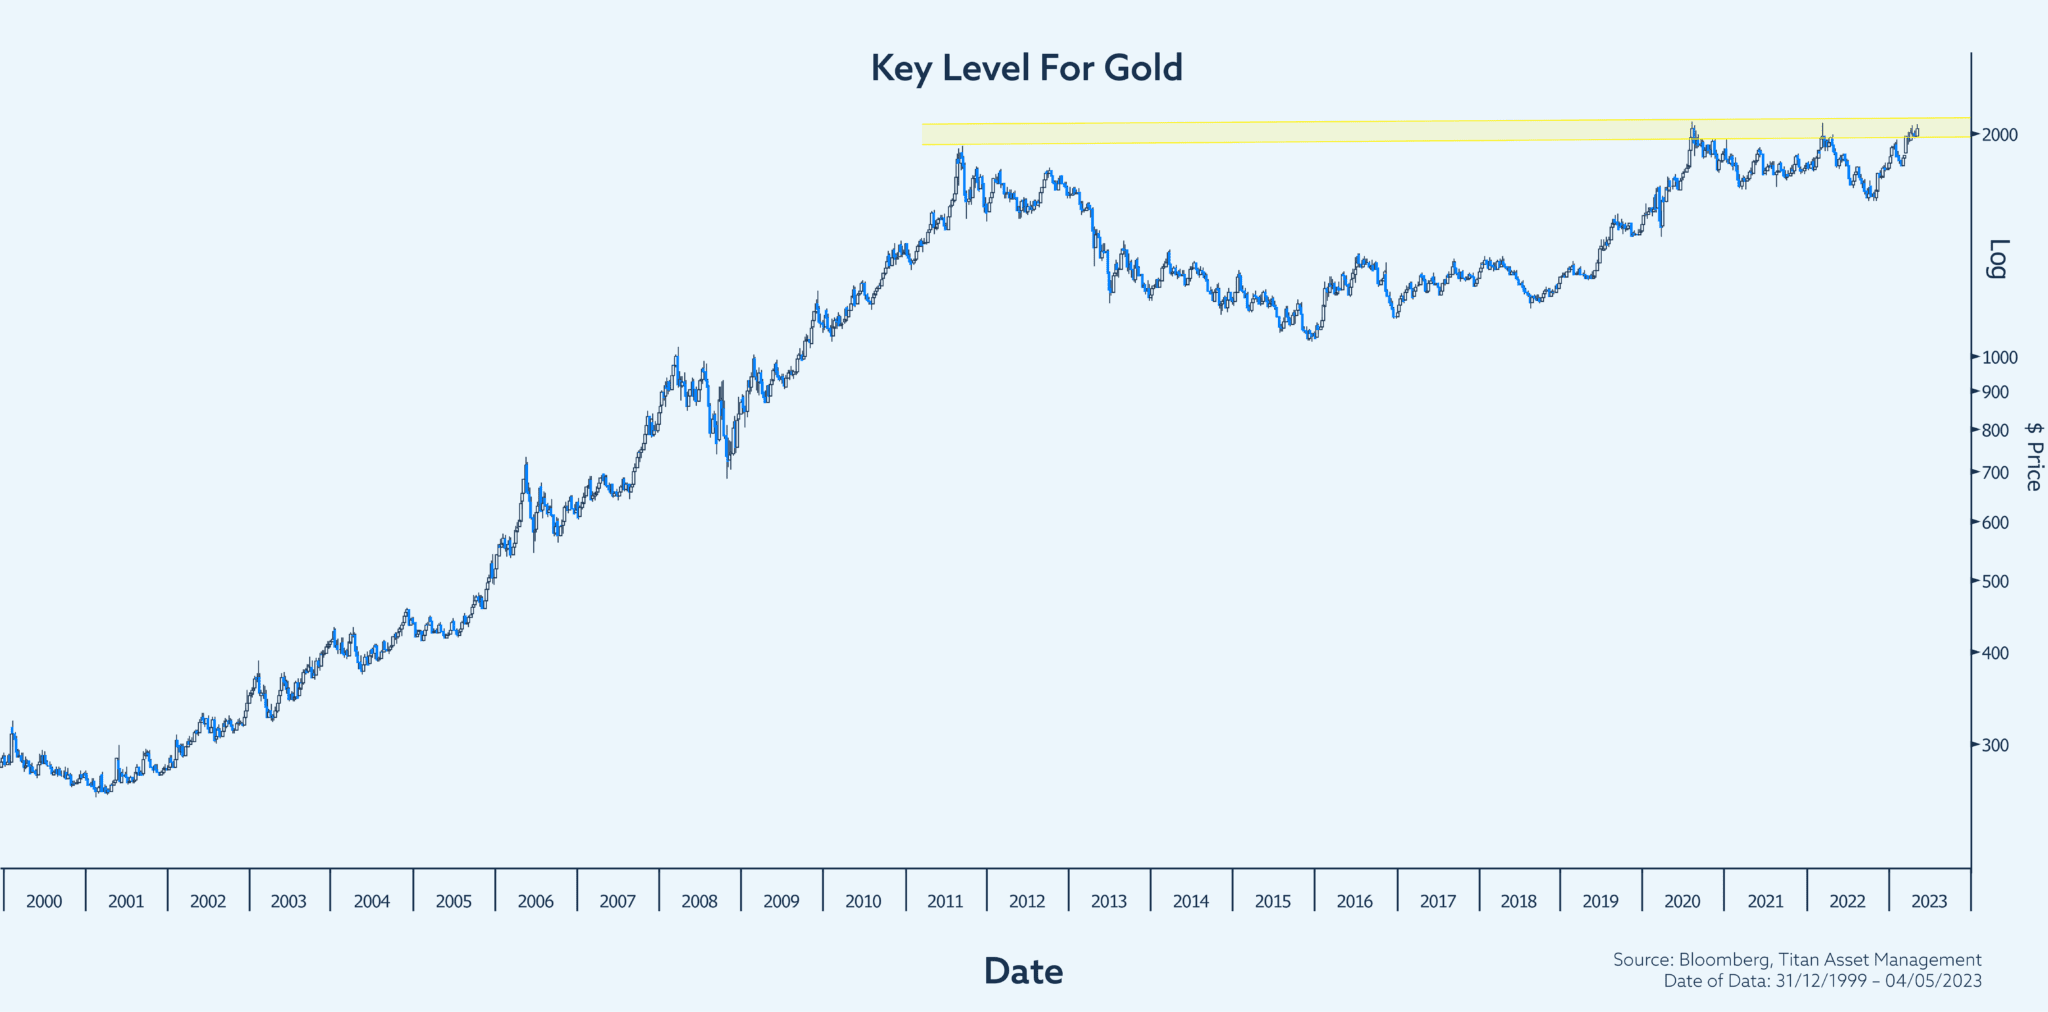
Gold – running into resistance or ‘this time it’s different’?
This blog has covered quite a lot of ground regarding quite a complex subject matter. The main aim was to highlight the quantitative tools we use and the holistic approach we take to risk management, where the marriage of fundamental and technical analysis can help reduce risk and improve investor returns.
Alex Livingstone